PublicMind Polling, Surveys, Market Analysis
Loading
For Immediate Release … Tuesday, June 3, 2014 8 pp.
Contact: Krista Jenkins 908.328.8967 (cell) or 973.443.8390 (office)
kjenkins@fdu.edu
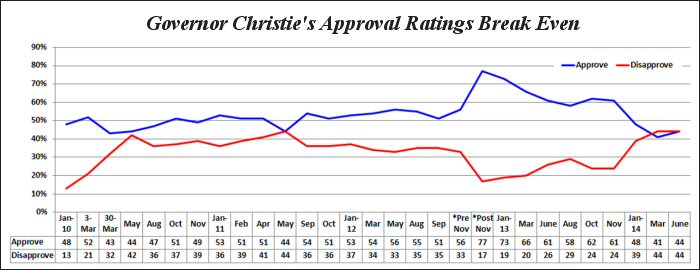
Interest in Bridgegate is down and Governor Christie’s approval ratings have stabilized, according to the most recent statewide survey of registered voters from Fairleigh Dickinson University’s PublicMind. Only a quarter (22%) now say they are following news about Bridgegate “very closely,” down from 34 percent in March and 38 percent in January. And following a steep drop in support for the governor earlier this year, his approval remains statistically unchanged from its level in March when 41 percent approved of his job performance. Today, 44 percent of registered voters are satisfied with his governance, a number that is identical to those who disapprove of his job performance. In November of last year, he registered a 61 percent approval among voters, a number that fell considerably following Bridgegate revelations, to 48 percent in January.
“Of course I’m sure he’d rather have approval ratings in the 60s than 40s, but public approval has not declined further, and that is good news for governor. Add to this a decline in interest in Bridgegate, and the approaching summer may end up feeling that much warmer to Governor Christie,” said Krista Jenkins, director of the poll and professor of political science at Fairleigh Dickinson University.
Despite the stabilization, Christie continues to struggle with groups whose support once defined his unique bipartisan appeal, losing ground with Democrats and independents over the past year. For example, although Democrats have always been less likely to support him than Republicans, it’s often been the case that more Democrats liked than disliked his job performance. A year ago in June 2013, a plurality of Democrats approved of his job performance (44%) with a third (38%) who disapproved. Today, around a quarter (26%) of Democrats give him a thumbs-up, compared with 61 percent who disapprove. And independents have generally been more likely to favor than disfavor his job performance. In June 2013, 64 percent favored his governance with a quarter (24%) who disapproved. Today, the governor is upside down in regard to independents, as 40 percent approve with 46 percent disapproving.
“Governor Christie’s support comes from predictable sources — his base. At least for now, he can no longer claim the widespread bipartisan appeal that made his national appeal unique relative to other prospective candidates for the White House in 2016,” said Jenkins.
Another group whose unusual degree of support made the governor appear distinctive is public employee households. A year ago, 52 percent of those who reside in households with a public employee union member approved of the governor with 36 percent who disapproved. Today, those numbers are considerably reversed: 22 percent approve with close to two-thirds (65%) who disapprove.
“The governor’s decline in support among public employee union households is no doubt related to his plan to take money from the pension fund in order to plug a budget shortfall,” said Jenkins. “His belief that it’s better to cut payments rather than raise taxes doesn’t sit well with pension recipients and their families.” [Note: PublicMind will release findings on public attitudes toward pension reform later this week]
The same survey finds Garden State voters are divided over how much weight should be given to Bridgegate when evaluating the governor. Forty-five percent of respondents say Bridgegate affects their opinion of the governor “a great deal” or “some,” with slightly more (52%) who say its influence is either a “little” or “none at all.” Independents are the most divided, with Democrats and Republicans diametrically opposed in their assessment of Bridgegate’s relevance.
When it comes to the governor’s believability, Garden State voters are just as dubious as they were earlier this year. In January, a majority (53%) said it was unlikely that Governor Christie didn’t know about the lane closures on the GWB before emails and text messages were released publicly. Today, that number has increased to 58 percent.
Those who seem willing to give him the benefit of the doubt are more likely to be following than not following Bridgegate. Forty percent of those who say they are following Bridgegate “very closely” say it’s likely that he didn’t know what his aides were up to, compared with 32 percent who are following it “somewhat closely” and 24 percent who aren’t paying any attention to the investigation.
“As much as voters may have thought the Mastro report was more self-serving than illuminating, it looks like the governor’s claims of ignorance are getting through in news reports and helping him out among some voters,” said Jenkins.
In other findings, for the first time in over two years, right direction/wrong track numbers are upside down. Right now, 40 percent of voters believe the state is headed in the right direction with 48 percent who believe it is on the wrong track. The last time more registered voters were pessimistic than optimistic was in January 2012 when more were concerned (47%) than satisfied (44%).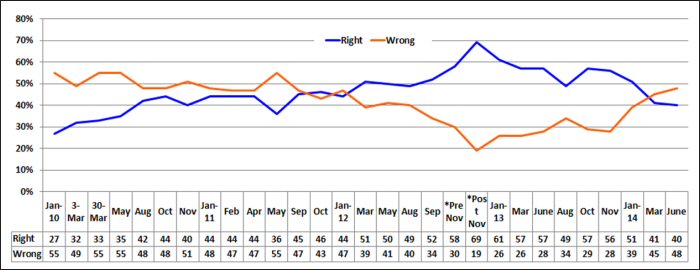
“Budget shortfalls, a slower than hoped for Sandy recovery, and Bridgegate could be to blame,” said Jenkins. “Of course, it’s better for a presumptive presidential candidate for voters at home to feel more sanguine about things than they do now.”
Attitudes toward the legislature in its responsiveness to Bridgegate have changed since the last time FDU queried voters. In March, a third (32%) said the legislature was doing an “excellent” or “good” job in its investigative role. Today, that number is now closer to a quarter (24%). Even Democrats are largely disapproving of the legislature, as 60% say it’s doing only a “fair” or “poor” job.
However, the governor’s numbers are unchanged on this question. Three-in-ten offer a positive appraisal, with significantly more (63%) who disapprove.
“Neither branch of government is seen as doing their job when it comes to Bridgegate,” said Jenkins. “It looks like both Democrats and Republicans are seen as mishandling one of the most significant political controversies in recent decades.”
The Fairleigh Dickinson University poll of 813 registered voters in New Jersey was conducted by telephone with both landline and cell phones from May 27 through June 1 and has a margin of error of +/-3.4 percentage points.
Methodology, questions, and tables on the web at: http://publicmind.fdu.edu
Radio actualities at 201.692.2846 For more information, please call 201.692.7032
Methodology
The most recent survey by Fairleigh Dickinson University’s PublicMind was conducted by telephone from May 27 through June 1 using a randomly selected sample of 813 registered voters who reside in New Jersey. One can be 95 percent confident that the error attributable to sampling has a range of +/- 3.4 percentage points. The margin of error for subgroups is larger and varies by the size of that subgroup. Survey results are also subject to non-sampling error. This kind of error, which cannot be measured, arises from a number of factors including, but not limited to, non-response (eligible individuals refusing to be interviewed), question wording, the order in which questions are asked, and variations among interviewers.
PublicMind interviews are conducted by Opinion America of Cedar Knolls, NJ, with professionally trained interviewers using a CATI (Computer Assisted Telephone Interviewing) system. Random selection is achieved by computerized random-digit dialing. This technique gives every person with a landline phone number (including those with unlisted numbers) an equal chance of being selected.
Landline households are supplemented with a separate, randomly selected sample of cell-phone respondents interviewed in the same time frame. The total combined sample is mathematically weighted to match known demographics of age, race and gender.
Tables
|
Turning to New Jersey, do you approve or disapprove of the job Chris Christie is doing as governor? |
||||||||||
|
|
All |
PID |
Gender |
Race |
Public employee household |
|||||
|
|
|
Dem |
Ind |
Repub |
Male |
Female |
White |
Non-white |
Yes |
No |
|
Approve |
44% |
26 |
40 |
70 |
46 |
42 |
50 |
30 |
22 |
52 |
|
Disapprove |
44% |
61 |
46 |
19 |
43 |
46 |
40 |
51 |
65 |
37 |
|
Neither (vol) |
8% |
9 |
9 |
8 |
7 |
9 |
7 |
12 |
9 |
8 |
|
DK (vol) |
4% |
4 |
5 |
2 |
4 |
4 |
3 |
7 |
5 |
4 |
|
Turning to New Jersey, do you approve or disapprove of the job Chris Christie is doing as governor? |
|||||
|
|
All |
Importance of Bridgegate |
|||
|
|
|
Great deal |
Some |
Just a little |
None |
|
Approve |
44% |
12 |
36 |
55 |
66 |
|
Disapprove |
44% |
82 |
51 |
36 |
21 |
|
Neither |
8% |
3 |
9 |
8 |
11 |
|
DK/Ref (vol) |
4% |
2 |
4 |
2 |
3 |
|
How closely are you following the recent controversy over the September 2013 lane closures on the George Washington Bridge? |
||||||||||
|
|
All |
PID |
Gender |
Race |
Public employee household |
|||||
|
|
|
Dem |
Ind |
Repub |
Male |
Female |
White |
Non-white |
Yes |
No |
|
Very closely |
22% |
26 |
22 |
17 |
24 |
19 |
22 |
20 |
29 |
19 |
|
Somewhat closely |
48% |
48 |
43 |
50 |
50 |
46 |
51 |
44 |
51 |
47 |
|
Not at all closely |
29% |
25 |
34 |
32 |
25 |
33 |
26 |
34 |
18 |
33 |
|
DK/Ref (vol) |
1% |
1 |
- |
- |
1 |
1 |
- |
2 |
2 |
1 |
|
How closely are you following the recent controversy over the September 2013 lane closures on the George Washington Bridge? |
|||
|
|
June |
March |
January |
|
Very closely |
22% |
34% |
38% |
|
Somewhat closely |
48% |
48% |
47% |
|
Not at all closely |
29% |
18% |
15% |
|
DK/Ref (vol) |
1% |
0% |
0 |
|
To what extent, if at all, does the Bridgegate investigation affect your opinion of the governor? Would you say it affects it… |
||||||||||
|
|
All |
PID |
Gender |
Race |
Public employee household |
|||||
|
|
|
Dem |
Ind |
Repub |
Male |
Female |
White |
Non-white |
Yes |
No |
|
A great deal |
22% |
35 |
25 |
6 |
24 |
21 |
18 |
31 |
31 |
20 |
|
Some |
23% |
26 |
25 |
20 |
20 |
26 |
22 |
26 |
28 |
21 |
|
Just a little |
19% |
16 |
18 |
21 |
18 |
19 |
20 |
18 |
15 |
20 |
|
None at all |
33% |
19 |
30 |
52 |
35 |
31 |
38 |
19 |
23 |
36 |
|
DK/Ref (vol) |
4% |
4 |
3 |
2 |
4 |
2 |
2 |
6 |
3 |
3 |
|
In your opinion, how likely or unlikely [rotate] is it that Governor Christie was unaware that his aides ordered the lane closures on the George Washington Bridge before emails and text messages were released publicly? |
||||||||||||
|
|
|
PID |
Gender |
Race |
GWB Attentiveness |
|||||||
|
|
All |
Dem |
Ind |
Repub |
Male |
Female |
White |
Nonwhite |
Very |
Somewhat |
Not at all |
|
|
Very likely |
21% |
19 |
19 |
25 |
22 |
19 |
22 |
19 |
35 |
19 |
13 |
|
|
Somewhat likely |
11% |
9 |
10 |
14 |
11 |
11 |
11 |
10 |
5 |
13 |
11 |
|
|
Somewhat unlikely |
23% |
19 |
22 |
29 |
22 |
25 |
23 |
24 |
13 |
26 |
27 |
|
|
Very unlikely |
35% |
44 |
37 |
24 |
34 |
36 |
35 |
34 |
41 |
36 |
30 |
|
|
DK/Ref (vol) |
10% |
9 |
10 |
7 |
11 |
9 |
9 |
12 |
5 |
7 |
19 |
|
|
In your opinion, how likely or unlikely [rotate] is it that Governor Christie was unaware that his aides ordered the lane closures on the George Washington Bridge before emails and text messages were released publicly? |
||
|
|
June |
January |
|
Very likely |
21% |
24% |
|
Somewhat likely |
11% |
12% |
|
Somewhat unlikely |
23% |
21% |
|
Very unlikely |
35% |
32% |
|
DK/Ref (vol) |
10% |
11% |
|
In your opinion, do you think things in New Jersey are moving in the right direction or are they on the wrong track? |
||||||||||
|
|
All |
PID |
Gender |
Race |
Public employee household |
|||||
|
|
|
Dem |
Ind |
Repub |
Male |
Female |
White |
Non-white |
Yes |
No |
|
Right direction |
40% |
29 |
35 |
57 |
42 |
37 |
44 |
31 |
22 |
46 |
|
Wrong track |
48% |
59 |
50 |
32 |
48 |
48 |
44 |
55 |
68 |
41 |
|
DK/Ref (vol) |
13% |
12 |
15 |
12 |
10 |
14 |
12 |
14 |
10 |
13 |
|
How would you rate the job the legislature is doing in handling the investigation into the George Washington Bridge lane closings? |
|||||||||||
|
|
All |
March |
PID |
Gender |
Race |
Public employee household |
|||||
|
|
|
|
Dem |
Ind |
Repub |
Male |
Female |
White |
Non-white |
Yes |
No |
|
Excellent |
3% |
6% |
3 |
3 |
1 |
3 |
2 |
3 |
3 |
3 |
3 |
|
Good |
21% |
26% |
25 |
17 |
19 |
20 |
22 |
24 |
16 |
20 |
22 |
|
Fair |
35% |
33% |
38 |
31 |
35 |
29 |
41 |
34 |
39 |
43 |
33 |
|
Poor |
27% |
21% |
22 |
39 |
29 |
34 |
21 |
27 |
27 |
24 |
28 |
|
DK/Ref (vol) |
13% |
15% |
12 |
11 |
15 |
13 |
14 |
12 |
13 |
9 |
14 |
|
How would you rate the job the governor is doing in handling the investigation into the George Washington Bridge lane closings? |
|||||||||||
|
|
All |
March |
PID |
Gender |
Race |
Public employee household |
|||||
|
|
|
|
Dem |
Ind |
Repub |
Male |
Female |
White |
Non-white |
Yes |
No |
|
Excellent |
8% |
8% |
4 |
4 |
16 |
9 |
8 |
9 |
6 |
6 |
9 |
|
Good |
22% |
24% |
14 |
22 |
35 |
23 |
21 |
26 |
15 |
14 |
25 |
|
Fair |
31% |
29% |
29 |
34 |
30 |
28 |
33 |
31 |
32 |
32 |
30 |
|
Poor |
32% |
32% |
45 |
36 |
13 |
33 |
32 |
28 |
38 |
44 |
28 |
|
DK/Ref (vol) |
7% |
7% |
8 |
5 |
5 |
7 |
6 |
6 |
9 |
3 |
8 |
Exact Question Wording and Order
US1 and US2 withheld for future release
NJ1. Now thinking about New Jersey, do you approve or disapprove of the job Chris Christie is
doing as governor?
1 Approve
2 Disapprove
3 Neither or neutral (vol)
8 DK or both (vol)
9 Ref. (vol)
NJ2. In your opinion, do you think things in New Jersey are moving in the right direction or are they on the wrong track? [Randomize right direction/wrong track]
1 Right direction
2 Wrong track
8 DK/Unsure (vol)
9 Refused (vol)
NJ3 and NJ4 withheld for future release
BG1 How closely are you following the recent controversy over the September 2013 lane closures on the George Washington Bridge?
1 Very closely
2 Somewhat closely
3 Not at all closely
8 DK/Ref
BG2 In your opinion, how likely or unlikely [rotate] is it that Governor Christie was unaware that his aides ordered the lane closures on the George Washington Bridge before emails and text messages were released publicly?
1 Very likely
2 Somewhat likely
3 Somewhat unlikely
4 Very unlikely
8 DK/Ref (vol)
BG3 How would you rate the job the legislature is doing in handling the investigation into the George Washington Bridge lane closings?
1 Excellent
2 Good
3 Fair
4 Poor
8 DK/Ref (vol)
BG4 How would you rate the job the governor is doing in responding to the investigations into the George Washington Bridge lane closings?
1 Excellent
2 Good
3 Fair
4 Poor
8 DK/Ref (vol)
BG5 To what extent, if at all, does the Bridgegate investigation affect your opinion of the Governor? Would you say it affects it…
1 A great deal
2 Some
3 Just a little
4 None at all
8 DK/Ref (vol)
|
|
|
Registered voters N = 813; MoE = +/- 3.4 |
|
Gender |
Male |
49% |
|
|
Female |
51% |
|
Age |
18-34 |
23% |
|
|
35-59 |
45% |
|
|
60+ |
29% |
|
|
Refused |
2% |
|
Race |
White |
65% |
|
|
African American |
12% |
|
|
Hispanic |
13% |
|
|
Asian |
3% |
|
|
Other/Refused |
6% |
|
Union household |
Self |
14% |
|
|
Someone else |
10% |
|
|
No |
74% |
|
|
DK/Refused |
1% |
|
Party (with leaners) |
Dem |
47% |
|
|
Ind/DK/Refused |
19% |
|
|
Repub |
33% |