PublicMind Polling, Surveys, Market Analysis
Loading
For immediate release Tuesday, March 11, 2014 9 pp.
Contact: Krista Jenkins 908.328.8967 (cell) or 973.443.8390 (office); kjenkins@fdu.edu
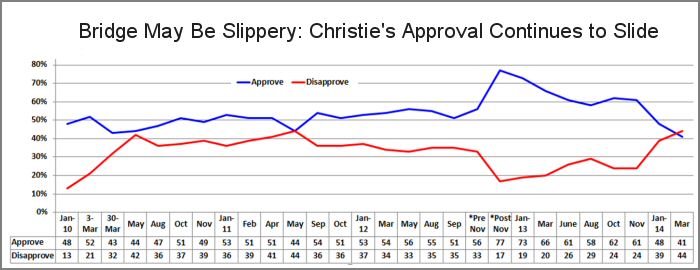
The investigation into the closure of lanes on the George Washington Bridge continues to draw the attention of registered voters in the Garden State. The most recent statewide survey from Fairleigh Dickinson University’s PublicMind finds that most voters offer largely disapproving evaluations of how relevant actors are performing their roles in the ongoing investigation, and when it comes to support for the governor, the investigation continues to take its toll with Governor Christie’s job performance approval at 41 percent.
Christie Approval in Scandal’s Wake
As the so-called “Bridgegate” investigation continues, the governor’s approval numbers in the state among registered voters are down a bit from January. Back then, 48 percent said they approved of his job performance. Today that number is 41 percent with 44 percent who disapprove. In November of last year, the governor enjoyed the approval of 61 percent of registered voters.
Currently about equal numbers of registered voters like or dislike everything about him. About a third (31%) say they like the governor and his policies while virtually the same number (33%) dislike the governor and his policies.
“Unfortunately for the governor, the investigation appears to be turning him into a more polarizing figure,” said Jenkins. “As recently as late last year, his approval numbers were consistently bigger than his disapproves - by a pretty big margin - and more voters liked everything about him than disliked everything about him. One of the defining characteristics of the governor that makes him a nationally sought after Republican is his widespread appeal in a Democratic state. Bridgegate continues to erode that asset.”
Barely a quarter of Democrats approve of his job performance (24%), but almost half of independents (47%) say the same, a number that’s closer to the two-thirds of Republicans (66%) who like the job he’s doing. Before the controversy came to light (November 2013), he had the support of 42 percent of Democrats, 66 percent of independents, and 84 percent of Republicans.
Public employee union households, long a source of an unusually high degree of support for the governor, are considerably more disapproving than approving in recent days. In October of last year, 44 percent of those who reside in union households approved of the job he was doing. In January, after the allegations of misconduct came to light, that number dropped to 33 percent, and it falls further this month to 28 percent.
“With someone other than Governor Christie, these numbers wouldn’t be noteworthy. However, his appeal to groups who are historically antagonistic to someone with a history of tangling publicly with unions was always something that helped to burnish his bipartisan appeal. This, too, appears to be a casualty attributable to Bridgegate, at least for now,” said Jenkins.
Investigating Bridgegate: The legislature, governor, and media
Eighty-two percent of registered voters statewide are following events concerning the lane closure investigation closely, with a third (34%) paying very close attention, a number that’s statistically unchanged from a little more than a month ago when the same question was asked. Regarding how those central to the investigation are handling their roles, the majority of respondents have less than positive things to say about the legislature, governor, and media.
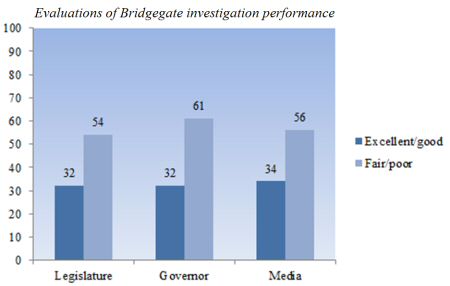
Beginning with elected officials, among registered voters over half (54%) say the legislature’s investigative performance has been only fair or poor, with around a third (32%) who say the legislature has done an excellent or good job so far. The governor’s response to the investigation fares about the same. Thirty-two percent evaluate his response as excellent or good, however significantly more (61%) say his response has been only fair or poor. Partisanship doesn’t appear to play a role in shaping responses to legislative behavior. However, when it comes to the governor, Republicans and independents are more supportive of his response than Democrats (50% and 36%, respectively versus 21%). Once a source of support, Democrats, who comprise a majority in the state, are decidedly less happy with the governor’s response.
“Although alleged wrongdoing in politics isn’t new, voters expect those involved to conduct and respond to investigations in a way that’s reasonably efficient and non-partisan. Given the good amount of attention that voters are paying to the investigation, these numbers suggest elected officials could be doing a better job in managing the investigation,” said Krista Jenkins, director of PublicMind and professor of political science at Fairleigh Dickinson University.
In the case of the media, it too has evaluations that are upside down. Over half (56%) say coverage so far has been fair or poor, with 38 percent who offer a largely positive appraisal. Opinion is more divided on whether the media’s coverage of the Republican governor is compromised by a liberal bias. Forty-six percent say media coverage of the Bridgegate scandal is reflective more of a liberal bias than the true seriousness of the allegations, with 43 percent who say media coverage has been fairly objective so far.
“In situations like this, it’s not uncommon for politicians to argue the media is presenting information that’s one-sided and biased against them. Blaming the messenger is a tried and true strategy in American politics. Although divided, there’s enough suspicion among the public for the governor to claim coverage is being driven more by bias than objectivity,” said Jenkins.
The prism of partisanship is clear when it comes to media evaluations. Democrats are significantly more likely than independents and Republicans to rate the job of the media in covering Bridgegate positively, and that objectivity reigns as opposed to a liberal bias. Over half of Democrats (53%) say coverage has been excellent or good so far, as compared with a third of independents (32%) and a fifth of Republicans (22%). Almost two thirds of Democrats (61%) say coverage has been largely objective so far, compared with just about a third of independents (34%) and a little more than a fifth of Republicans (22%).
“Republicans see their guy under the microscope, so they’re more likely to have their radar honed to any liberal bias in coverage. Conversely, Democrats see the opposite, so they’re more likely to see what’s being presented as fact,” said Jenkins.
The same survey asked where voters get the majority of their news and information. Those who get their news online and by watching cable news are the most likely to see bias in coverage of Bridgegate (52% and 58%, respectively), compared with those who get their news elsewhere. Newspaper readers are the most likely to believe what they read is presented in a more objective than biased way.
“The degree to which newspapers continue to devote more space to stories, in contrast to cable news sound bites and opinion journalism, is likely helping to explain why newspaper readers see the news about Bridgegate a little differently,” said Jenkins.
The Fairleigh Dickinson University poll of 703 registered voters in New Jersey was conducted by telephone with both landline and cell phones from March 3 through March 9. The margin of error is +/- 3.7 percentage points.
Methodology, questions, and tables on the web at: http://publicmind.fdu.edu
Radio actualities at 201.692.2846 For more information, please call 201.692.7032
Methodology
The most recent survey by Fairleigh Dickinson University’s PublicMind was conducted by telephone from March 4 through March 9 using a randomly selected sample of 703 registered voters in New Jersey. One can be 95 percent confident that the error attributable to sampling has a range of +/- 3.7 percentage points. The margin of error for subgroups is larger and varies by the size of that subgroup. Survey results are also subject to non-sampling error. This kind of error, which cannot be measured, arises from a number of factors including, but not limited to, non-response (eligible individuals refusing to be interviewed), question wording, the order in which questions are asked, and variations among interviewers.
PublicMind interviews are conducted by Opinion America of Cedar Knolls, NJ, with professionally trained interviewers using a CATI (Computer Assisted Telephone Interviewing) system. Random selection >is achieved by computerized random-digit dialing. This technique gives every person with a landline phone number (including those with unlisted numbers) an equal chance of being selected.
Landline households are supplemented with a separate, randomly selected sample of cell-phone respondents interviewed in the same time frame. The total combined sample is mathematically weighted to match known demographics of age, race and gender.
Tables
|
And turning to New Jersey, do you approve or disapprove of the job Chris Christie is doing as governor? [Randomize approve/disapprove] |
|||||||||||||
|
|
|
PID |
Gender |
Race |
Union household? |
Following Bridgegate closely… |
|||||||
|
|
All |
Dem |
Ind |
Repub |
Male |
Female |
White |
Non-white |
Yes |
No |
Very |
Somewhat |
Not at all |
|
Approve |
41% |
24 |
47 |
66 |
42 |
40 |
47 |
28 |
28 |
46 |
33 |
44 |
49 |
|
Disapprove |
44% |
65 |
36 |
19 |
43 |
46 |
38 |
57 |
62 |
39 |
58 |
41 |
29 |
|
Neither (vol) |
11% |
7 |
13 |
13 |
11 |
11 |
11 |
10 |
7 |
11 |
7 |
11 |
18 |
|
DK/Ref (vol) |
4% |
3 |
4 |
2 |
3 |
4 |
3 |
5 |
3 |
4 |
2 |
5 |
4 |
|
I’m going to read you four statements about Chris Christie. Please tell me which comes closest to your own views: 1) I like him, AND I like his policies; 2) I like him, BUT I don’t like his policies; 3) I don’t like him, BUT I like his policies; 4) I don’t like him, AND I don’t like his policies. |
|||||||||||||
|
|
|
PID |
Gender |
Race |
Union household? |
Following Bridgegate closely… |
|||||||
|
|
All |
Dem |
Ind |
Repub |
Male |
Female |
White |
Nonwhite |
Yes |
No |
Very |
Somewhat |
Not at all |
|
Like him & policies |
31% |
11 |
39 |
60 |
31 |
32 |
40 |
12 |
19 |
35 |
28 |
32 |
38 |
|
Like him, not policies |
18% |
22 |
18 |
14 |
22 |
15 |
15 |
27 |
14 |
20 |
16 |
20 |
20 |
|
Dislike him, like policies |
10% |
10 |
12 |
11 |
11 |
10 |
10 |
11 |
11 |
10 |
7 |
15 |
6 |
|
Don’t like him or policies |
33% |
52 |
22 |
12 |
30 |
36 |
28 |
43 |
50 |
28 |
46 |
29 |
22 |
|
DK/Ref. (vol) |
7% |
6 |
10 |
4 |
7 |
7 |
6 |
8 |
5 |
7 |
4 |
5 |
14 |
|
In your opinion, do you think things in New Jersey are moving in the right direction or are they on the wrong track? [Randomize right direction/wrong track] |
|||||||||||||
|
|
|
PID |
Gender |
Race |
Union household? |
Following Bridgegate closely… |
|||||||
|
|
All |
Dem |
Ind |
Repub |
Male |
Female |
White |
Nonwhite |
Yes |
No |
Very |
Somewhat |
Not at all |
|
Right direction |
41% |
24 |
44 |
65 |
46 |
36 |
46 |
28 |
34 |
42 |
31 |
45 |
45 |
|
Wrong track |
45% |
63 |
40 |
20 |
41 |
48 |
39 |
57 |
55 |
42 |
58 |
40 |
34 |
|
DK/Ref (vol) |
14% |
12 |
16 |
16 |
13 |
16 |
15 |
15 |
11 |
16 |
11 |
15 |
21 |
|
How closely are you following the recent controversy over the September 2013 lane closures on the George Washington Bridge? |
||||||||||
|
|
|
PID |
Gender |
Race |
Union household? |
|||||
|
|
All |
Dem |
Ind |
Repub |
Male |
Female |
White |
Nonwhite |
Yes |
No |
|
Very |
34% |
36 |
36 |
32 |
35 |
32 |
36 |
28 |
42 |
31 |
|
Somewhat |
48% |
45 |
52 |
50 |
48 |
48 |
47 |
49 |
51 |
47 |
|
Not at all |
18% |
20 |
12 |
16 |
16 |
19 |
16 |
22 |
7 |
21 |
|
DK/Ref (vol) |
0% |
0 |
0 |
2 |
0 |
0 |
0 |
1 |
0 |
0 |
|
How would you rate the job the legislature is doing in handling the investigation into the George Washington Bridge lane closings? |
|||||||||||||
|
|
|
PID |
Gender |
Race |
Union household? |
Following Bridgegate closely… |
|||||||
|
|
All |
Dem |
Ind |
Repub |
Male |
Female |
White |
Nonwhite |
Yes |
No |
Very |
Somewhat |
Not at all |
|
Excellent |
6% |
9 |
3 |
2 |
8 |
3 |
5 |
7 |
8 |
5 |
12 |
2 |
3 |
|
Good |
26% |
32 |
21 |
21 |
25 |
27 |
26 |
25 |
24 |
26 |
34 |
23 |
16 |
|
Fair |
33% |
31 |
37 |
35 |
31 |
35 |
33 |
30 |
42 |
30 |
27 |
38 |
30 |
|
Poor |
21% |
16 |
22 |
28 |
24 |
18 |
20 |
23 |
16 |
22 |
18 |
24 |
18 |
|
DK/Ref. (vol) |
15% |
11 |
18 |
15 |
13 |
17 |
16 |
14 |
9 |
17 |
8 |
13 |
33 |
|
How would you rate the job the governor is doing in responding to the investigation into the George Washington Bridge lane closings? |
|||||||||||||
|
|
|
PID |
Gender |
Race |
Union household? |
Following Bridgegate closely… |
|||||||
|
|
All |
Dem |
Ind |
Repub |
Male |
Female |
White |
Nonwhite |
Yes |
No |
Very |
Somewhat |
Not at all |
|
Excellent |
8% |
5 |
9 |
14 |
11 |
5 |
9 |
6 |
6 |
9 |
11 |
7 |
5 |
|
Good |
24% |
16 |
27 |
36 |
23 |
25 |
28 |
16 |
15 |
27 |
23 |
26 |
19 |
|
Fair |
29% |
28 |
30 |
27 |
28 |
30 |
27 |
32 |
37 |
25 |
22 |
33 |
30 |
|
Poor |
32% |
46 |
24 |
17 |
30 |
33 |
29 |
39 |
39 |
30 |
40 |
31 |
19 |
|
DK/Ref. (vol) |
7% |
6 |
9 |
6 |
7 |
7 |
7 |
7 |
3 |
9 |
4 |
2 |
26 |
|
How would you rate the job the media is doing in covering the investigation into the George Washington Bridge lane closings? |
|||||||||||||
|
|
|
PID |
Gender |
Race |
Union household? |
Following Bridgegate closely… |
|||||||
|
|
All |
Dem |
Ind |
Repub |
Male |
Female |
White |
Nonwhite |
Yes |
No |
Very |
Somewhat |
Not at all |
|
Excellent |
11% |
19 |
7 |
4 |
14 |
9 |
9 |
15 |
14 |
11 |
21 |
5 |
10 |
|
Good |
27% |
34 |
25 |
18 |
26 |
28 |
27 |
28 |
29 |
26 |
33 |
25 |
18 |
|
Fair |
29% |
31 |
28 |
26 |
27 |
30 |
28 |
31 |
38 |
26 |
18 |
38 |
24 |
|
Poor |
27% |
12 |
32 |
46 |
27 |
27 |
30 |
20 |
16 |
31 |
26 |
30 |
23 |
|
DK/Ref. (vol) |
6% |
3 |
8 |
5 |
5 |
6 |
7 |
5 |
4 |
7 |
2 |
3 |
24 |
|
How would you rate the job the media is doing in covering the investigation into the George Washington Bridge lane closings? |
|||||||
|
|
|
Media sources |
|||||
|
|
All |
Cable news |
Internet not including newspapers |
Radio |
Newspaper |
Local or network TV news |
Other
|
|
Excellent |
11% |
12 |
6 |
25 |
14 |
7 |
8 |
|
Good |
27% |
27 |
21 |
15 |
30 |
34 |
25 |
|
Fair |
29% |
21 |
29 |
33 |
32 |
30 |
39 |
|
Poor |
27% |
36 |
38 |
19 |
19 |
22 |
29 |
|
DK/Ref. (vol) |
6% |
4 |
6 |
8 |
6 |
8 |
0 |
|
Which of the following statements best describes how you feel, even if neither is perfect: Media coverage of the Bridgegate scandal is reflective more of a liberal bias than the true seriousness of the allegations; or Media coverage of the Bridgegate scandal has been fairly objective so far. [Rotate] |
|||||||||||||
|
|
|
PID |
Gender |
Race |
Union household? |
Following Bridgegate closely… |
|||||||
|
|
All |
Dem |
Ind |
Repub |
Male |
Female |
White |
Nonwhite |
Yes |
No |
Very |
Somewhat |
Not at all |
|
Biased coverage |
46% |
28 |
51 |
71 |
46 |
46 |
51 |
36 |
43 |
47 |
42 |
52 |
38 |
|
Objective coverage |
43% |
61 |
34 |
22 |
44 |
42 |
40 |
51 |
52 |
39 |
52 |
41 |
30 |
|
Both/neither (vol) |
4% |
6 |
5 |
2 |
6 |
3 |
4 |
6 |
2 |
6 |
5 |
4 |
7 |
|
DK/Ref. (vol) |
7% |
5 |
9 |
4 |
5 |
8 |
6 |
8 |
3 |
7 |
2 |
3 |
24 |
|
Which of the following statements best describes how you feel, even if neither is perfect: Media coverage of the Bridgegate scandal is reflective more of a liberal bias than the true seriousness of the allegations; or Media coverage of the Bridgegate scandal has been fairly objective so far. [Rotate] |
|||||||
|
|
|
Media sources
|
|||||
|
|
All |
Cable news |
Internet not including newspapers |
Radio |
Newspaper |
Local or network TV news |
Other
|
|
Biased coverage |
46% |
58 |
52 |
36 |
35 |
45 |
43 |
|
Objective coverage |
43% |
36 |
35 |
47 |
56 |
41 |
50 |
|
Both/neither (vol) |
4% |
4 |
5 |
9 |
4 |
5 |
0 |
|
DK/Ref. (vol) |
7% |
3 |
9 |
8 |
5 |
9 |
7 |
|
We’re very interested in how people stay informed about what’s going on in the news. Which of the following sources do you rely on the MOST when getting your news and information about current events? [Rotate Order of items] |
|||||
|
Cable news |
Internet not including newspapers |
Radio |
Newspaper |
Local or network TV news |
Other
|
|
23% |
19% |
10% |
22% |
24% |
2% |
Exact Question Wording and Order
US1 and US2 withheld for future release
NJ1. And turning to New Jersey, do you approve or disapprove of the job Chris Christie is
doing as governor? [Randomize approve/disapprove]
1 Approve
2 Disapprove
3 Neither [vol] or Neutral [vol]
8 DK [vol] or both [vol]
NJ2. In your opinion, do you think things in New Jersey are moving in the right direction or are they on the wrong track? [Randomize right direction/wrong track]
1 Right direction
2 Wrong track
8 DK/Unsure (vol)
9 Refused (vol)
NJ3 I’m going to read you four statements about Chris Christie. Please tell me which comes closest to your own views: 1) I like him, AND I like his policies; 2) I like him, BUT I don’t like his policies; 3) I don’t like him, BUT I like his policies; 4) I don’t like him, AND I don’t like his policies.
RANDOMIZE BUT KEEP 1 AND 2, 3 AND 4 TOGETHER
1 I like him, AND I like his policies
2 I like him, BUT I don’t like his policies
3 I don’t like him, BUT I like his policies
4 I don’t like him, AND I don’t like his policies
8 DK [vol]
NJ4 How closely are you following the recent controversy over the September 2013 lane closures on the George Washington Bridge?
1 Very closely
2 Somewhat closely
3 Not at all closely
8 DK/Ref
[Rotate NJ 8-10]
NJ8 How would you rate the job the legislature is doing in handling the investigation into the George Washington Bridge lane closings?
1 Excellent
2 Good
3 Fair
4 Poor
NJ9 How would you rate the job the media is doing in covering the investigation into the George Washington Bridge lane closings?
1 Excellent
2 Good
3 Fair
4 Poor
NJ10 How would you rate the job the governor is doing in responding to the investigations into the George Washington Bridge lane closings?
1 Excellent
2 Good
3 Fair
4 Poor
NJ11 Which of the following statements best describes how you feel, even if neither is perfect: Media coverage of the Bridgegate scandal is reflective more of a liberal bias than the true seriousness of the allegations; or Media coverage of the Bridgegate scandal has been fairly objective so far
1 Media coverage is biased
2 Media coverage is objective
3 Both/neither
8 DK/Refused
POT1 through ID6 withheld for future release
M1 We’re very interested in how people stay informed about what’s going on in the news. Which of the following sources do you rely on the MOST when getting your news and information about current events? [Rotate Order of items]
1 Cable news
2 The internet, NOT including newspapers
3 The radio
4 A local or national newspaper that you read online or in print
5 Local or network television news
6 Other
99 DK/Refused
Weighted sample characteristics
|
|
|
Registered voters N = 703; MoE = +/- 3.7 |
|
Gender |
Male |
49% |
|
|
Female |
51% |
|
Age |
18-34 |
22% |
|
|
35-59 |
45% |
|
|
60+ |
30% |
|
|
Refused |
3% |
|
Race |
White |
67% |
|
|
African American |
12% |
|
|
Hispanic |
13% |
|
|
Asian |
4% |
|
|
Other/Refused |
4% |
|
Union household |
Self |
14% |
|
|
Someone else |
8% |
|
|
No |
75% |
|
Party (with leaners) |
Dem |
45% |
|
|
Ind/DK/Refused |
25% |
|
|
Repub |
30% |