PublicMind Polling, Surveys, Market Analysis
Loading
For Immediate Release, Monday, November 3 5 pages
Contact: Krista Jenkins 973.443.8390
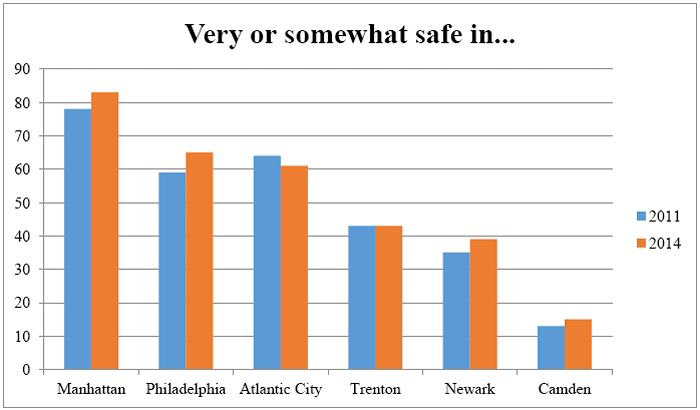
If safety is a consideration when people decide which city to visit, not all metropolitan centers in the tri-state area are created equal. In the most recent statewide survey of registered voters from Fairleigh Dickinson University’s PublicMind, people were asked about how safe they feel in big cities including Manhattan, Atlantic City, Philadelphia, Camden, Trenton, and Newark. As they did in 2011, voters place Manhattan atop the list of safe cities to visit. Camden remains the place where voters feel the least safe. A third of all respondents say they feel very safe in the Big Apple (32%), with numbers in the single digits for Camden (2%). In between are Philadelphia (13%), Atlantic City (11%), Newark (5%), and Trenton (7%).
PublicMind first asked these questions in 2011, and the numbers have changed little in the interim. At that time, New York City topped the list for safety, followed by Atlantic City, Philadelphia, Trenton, Newark, and Camden.
“The traditional ‘tourist’ destinations like Atlantic City, Philly, and New York City are clearly communicating an ethos of public safety. Unfortunately, cities that would like to attract the attention and dollars of outsiders continue to struggle with perceptions of danger lurking around the corner” said Krista Jenkins, professor of political science and director of the poll.
To some extent, perceptions of public safety pivot on one’s vantage point in the state. For example, those who reside in the “urban core” of the state, or those in Hudson, Essex, and Union counties are more likely to look at Newark and think of it as a reasonably safe place to visit, as compared with those who live in other regions in the state. And, those who reside in the southern part of the state, and who are arguably the least well positioned to visit New York City, are the least likely to say they feel very or somewhat safe when they visit Manhattan (67%).
“Proximity matters, to a point. The fact that some cities are considered safer by those from the same or neighboring communities suggests direct experience matters. Maybe you’ve been there and nothing bad happened, but if you’ve never been there and you only hear about bad things that happen there on the news, geographic differences in perception make sense,” said Jenkins.
The Fairleigh Dickinson University poll of 1107 registered voters in New Jersey was conducted by telephone with both landline and cell phones from October 13 through October 19, 2014, and has a margin of error of +/-2.9 percentage points.
Methodology, questions, and tables on the web at: http://publicmind.fdu.edu
Radio actualities at 201.692.2846 For more information, please call 201.692.7032
Methodology
The most recent survey by Fairleigh Dickinson University’s PublicMind was conducted by telephone from October 13 through October 19, 2014 using a randomly selected sample of 1107 registered voters who reside in New Jersey. One can be 95 percent confident that the error attributable to sampling has a range of +/-2.9 percentage points. The margin of error for subgroups is larger and varies by the size of that subgroup. Survey results are also subject to non-sampling error. This kind of error, which cannot be measured, arises from a number of factors including, but not limited to, non-response (eligible individuals refusing to be interviewed), question wording, the order in which questions are asked, and variations among interviewers.
PublicMind interviews are conducted by Opinion America of Cedar Knolls, NJ, with professionally trained interviewers using a CATI (Computer Assisted Telephone Interviewing) system. Random selection >is achieved by computerized random-digit dialing. This technique gives every person with a landline phone number (including those with unlisted numbers) an equal chance of being selected.
Landline households are supplemented with a separate, randomly selected sample of cell-phone respondents interviewed in the same time frame. The total combined sample is mathematically weighted to match known demographics of age, race and gender.
The following tables are based on all registered voters in the sample.
Tables
In general, how safe do you think you are in…..
|
Manhattan |
|||||||||
|
|
All |
2011 |
Male |
Female |
Northeast |
Urban core |
Northwest |
Central |
South |
|
Very safe |
32% |
33% |
38 |
26 |
32 |
35 |
33 |
32 |
26 |
|
Somewhat safe |
51% |
45% |
48 |
53 |
54 |
52 |
51 |
52 |
41 |
|
Not too safe |
7% |
6% |
6 |
9 |
9 |
6 |
6 |
5 |
10 |
|
Not at all safe |
4% |
4% |
3 |
5 |
3 |
2 |
7 |
5 |
4 |
|
DK/Ref (vol) |
6% |
12% |
6 |
7 |
2 |
6 |
3 |
5 |
19 |
|
Philadelphia |
|||||||||
|
|
All |
2011 |
Male |
Female |
Northeast |
Urban core |
Northwest |
Central |
South |
|
Very safe |
13% |
12% |
15 |
11 |
6 |
13 |
14 |
13 |
17 |
|
Somewhat safe |
52% |
47% |
54 |
51 |
52 |
48 |
53 |
55 |
56 |
|
Not too safe |
13% |
12% |
11 |
14 |
10 |
14 |
11 |
14 |
12 |
|
Not at all safe |
7% |
10% |
8 |
7 |
10 |
4 |
7 |
7 |
11 |
|
DK/Ref (vol) |
15% |
19% |
12 |
18 |
22 |
21 |
15 |
12 |
4 |
|
Atlantic City |
|||||||||
|
|
All |
2011 |
Male |
Female |
Northeast |
Urban core |
Northwest |
Central |
South |
|
Very safe |
11% |
15% |
12 |
10 |
10 |
13 |
14 |
10 |
8 |
|
Somewhat safe |
50% |
49% |
52 |
49 |
49 |
49 |
46 |
53 |
54 |
|
Not too safe |
20% |
14% |
18 |
21 |
18 |
21 |
18 |
19 |
23 |
|
Not at all safe |
9% |
7% |
8 |
10 |
11 |
5 |
9 |
9 |
12 |
|
DK/Ref (vol) |
10% |
16% |
10 |
11 |
11 |
13 |
13 |
10 |
3 |
|
Trenton |
|||||||||
|
|
All |
2011 |
Male |
Female |
Northeast |
Urban core |
Northwest |
Central |
South |
|
Very safe |
7% |
4% |
8 |
5 |
5 |
7 |
8 |
6 |
7 |
|
Somewhat safe |
36% |
39% |
37 |
35 |
32 |
34 |
33 |
42 |
38 |
|
Not too safe |
23% |
16% |
21 |
24 |
22 |
18 |
22 |
27 |
23 |
|
Not at all safe |
18% |
17% |
18 |
18 |
18 |
17 |
23 |
17 |
16 |
|
DK/Ref (vol) |
16% |
23% |
16 |
17 |
24 |
24 |
15 |
8 |
15 |
|
Newark |
|||||||||
|
|
All |
2011 |
Male |
Female |
Northeast |
Urban core |
Northwest |
Central |
South |
|
Very safe |
5% |
5% |
7 |
3 |
5 |
6 |
7 |
3 |
3 |
|
Somewhat safe |
34% |
30% |
37 |
30 |
34 |
44 |
32 |
31 |
24 |
|
Not too safe |
25% |
24% |
23 |
28 |
26 |
22 |
25 |
28 |
26 |
|
Not at all safe |
29% |
31% |
26 |
32 |
31 |
25 |
32 |
29 |
27 |
|
DK/Ref (vol) |
7% |
11% |
7 |
8 |
3 |
4 |
4 |
9 |
19 |
|
Camden |
|||||||||
|
|
All |
2011 |
Male |
Female |
Northeast |
Urban core |
Northwest |
Central |
South |
|
Very safe |
2% |
2% |
2 |
1 |
2 |
2 |
2 |
1 |
1 |
|
Somewhat safe |
13% |
11% |
14 |
11 |
11 |
12 |
11 |
13 |
17 |
|
Not too safe |
20% |
18% |
20 |
19 |
20 |
19 |
20 |
19 |
28 |
|
Not at all safe |
51% |
46% |
51 |
52 |
52 |
46 |
52 |
54 |
51 |
|
DK/Ref (vol) |
15% |
22% |
13 |
17 |
15 |
20 |
15 |
12 |
3 |
*Northwest: Sussex, Hunterdon, Warren, Morris and Somerset counties
Northeast: Passaic and Bergen counties
Urban Core: Hudson, Essex and Union counties
Central: Ocean, Burlington, Mercer, Monmouth and Middlesex counties
South: Cape May, Atlantic, Cumberland, Gloucester, Camden and Salem counties
Exact Question Wording and Order
US1 and US2 released October 21
SEN1 and SEN2 released October 21
ID released October 21
BAIL1 and BAIL2 released October 21
GS1 and GS2 released October 21
ISSUES1 through ISSUES3 released October 21
NJ1 through NJ3 released October 23
EB1 through EB4 released October 26
Sample Characteristics
|
|
|
Registered voters N = 1107; MoE = +/- 2.9 |
|
Gender |
Male |
49% |
|
|
Female |
51% |
|
Age |
18-34 |
22% |
|
|
35-59 |
45% |
|
|
60+ |
31% |
|
|
Refused |
2% |
|
Race |
White |
68% |
|
|
African American |
12% |
|
|
Hispanic |
12% |
|
|
Asian |
3% |
|
|
Other/Refused |
4% |
|
Party (with leaners) |
Dem |
46% |
|
|
Ind/DK/Refused |
18% |
|
|
Repub |
36% |