PublicMind Polling, Surveys, Market Analysis
Loading
For immediate release… Tuesday, July 22, 2014 7 pp.
Contact: Krista Jenkins 908.328.8967 (cell) or 973.443.8390 (office)
As Governor Christie embarks on a multi-state tour as head of the Republican Governors’ Association, a statewide poll of registered voters from Fairleigh Dickinson University’s PublicMind finds him unable to regain the luster he once had back home as a rising bipartisan star. His job approval remains unchanged since its January drop: a majority of voters are expressing concern over the direction the state is headed, and over half believe that it’s unlikely the governor was unaware of his aides’ behavior in the Bridgegate scandal.
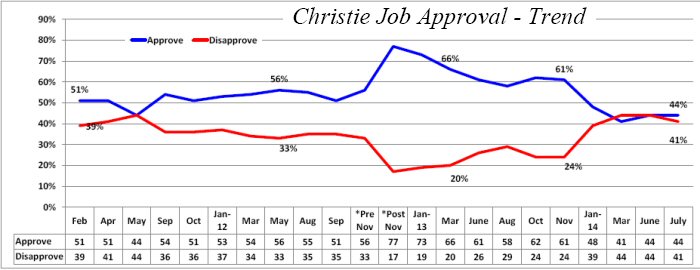
Right now, 44 percent say they approve of the job the governor is doing, with 41 percent who say they disapprove. In June, the approval number was the same and in March it was 41 percent. These numbers followed a precipitous drop in January after the Bridgegate allegations came to light. The governor remains divisive with less than a third of Democrats (28%) who approve of his job performance and less than half of independents (46%), compared with two-thirds of Republican voters (67%).
“The governor’s tour of such politically important states as Iowa and New Hampshire raises his profile as something more than a northeastern governor. What voters back home think of him and the health of New Jersey provides some degree of insight into the leadership skills he would bring to a national electorate,” said Krista Jenkins, director of PublicMind and professor of political science at Fairleigh Dickinson University.
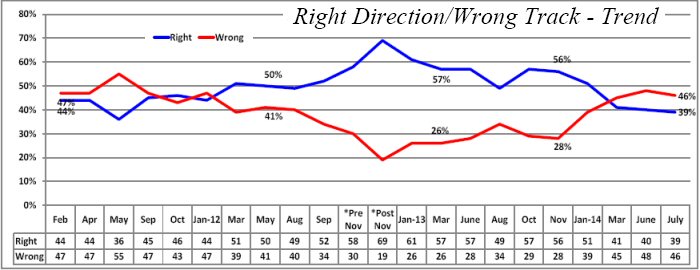
As for how the state is faring these days, right direction/wrong track numbers remain upside down, with more saying they’re worried about the direction the state is headed (46%) than expressing optimism (39%). These numbers are comparable to those observed in June, when for the first time since 2011 the public’s outlook was decidedly more gloomy than optimistic.
“Governor Christie’s ability to maintain the support of a plurality of voters in a Democratic state, despite his troubles of late, is good. But with 46 percent of voters saying the state is heading in the wrong direction, his narrative of effective leadership is thrown in doubt,” said Jenkins.
Turning to the slow-churning Bridgegate investigation, PublicMind finds that although relatively few are still paying close attention to the affair, a good many voters are expressing unease with its continuation. Right now, a quarter (24%) say they are paying close attention to the investigation, with another half (46%) percent who are following it somewhat closely. Almost a third (29%) are reportedly paying little, if any, attention to the ongoing investigations at both the state and federal level.
Despite the degree of public attentiveness, when asked whether the investigation into the George Washington Bridge lane closures in 2013 remains important or a distraction from some of the other bigger problems the state faces, opinion is divided. Forty-seven percent say it’s time to move on, with almost the same number (44%) who believe the investigation remains important, given the need to hold those to account for their behavior. Democrats (63%), non-white voters (51%) and those from public employee households (54%) are the most likely to want to see the investigation continue, although these groups are no more likely than others to be paying close attention to the investigation.
“‘Move along, nothing to see here’ is an apt way of describing the thoughts of many voters with regard to the Bridgegate investigation. Fatigue may be setting in, especially for those who expected a speedier resolution – one way or another – to the investigations by the feds and state legislature,” said Jenkins.
The same survey also finds that opinion is mixed over who is the most appropriate government entity to conduct the Bridgegate investigation – the U.S. Attorney or New Jersey Legislature. Right now, both levels of government are conducting investigations into the lane closures, and a plurality (47%) believe the feds should be the investigator of record, with a third (33%) who look to the New Jersey Legislature. Republican opinion is more divided than Democratic. Almost equal numbers of Republicans want the feds (37%) as want the legislature (43%). Among Democrats, by a two-to-one margin they prefer the federal government over the legislature (54 versus 27%, respectively).
“Many in the state are ready to hand the Bridgegate investigation off to the U.S. Attorney and allow state officials to focus on issues beyond the governor’s behavior in the Fall,” said Jenkins. “In the absence of any big news from either investigation, it’s proving hard to keep everyone focused on the reasons for the necessity of dual inquiries.”
Finally, the governor isn’t making much headway in the realm of believability, at least when it comes to his involvement – or lack thereof - in Bridgegate. Over half (56%) believe that it’s unlikely the governor was unaware of his aide’s behavior before the allegations came to light in January, a number that’s remained relatively constant since the story first broke.
The Fairleigh Dickinson University poll of 743 registered voters in New Jersey was conducted by telephone with both landline and cell phones from July 14 through July 20, 2014, and has a margin of error of +/-3.6 percentage points.
Methodology, questions, and tables on the web at: http://publicmind.fdu.edu
Radio actualities at 201.692.2846 For more information, please call 201.692.7032
Methodology
The most recent survey by Fairleigh Dickinson University’s PublicMind was conducted by telephone from July 14 through July 20, 2014 using a randomly selected sample of 743 registered voters who reside in New Jersey. One can be 95 percent confident that the error attributable to sampling has a range of +/- 3.6 percentage points. The margin of error for subgroups is larger and varies by the size of that subgroup. Survey results are also subject to non-sampling error. This kind of error, which cannot be measured, arises from a number of factors including, but not limited to, non-response (eligible individuals refusing to be interviewed), question wording, the order in which questions are asked, and variations among interviewers.
PublicMind interviews are conducted by Opinion America of Cedar Knolls, NJ, with professionally trained interviewers using a CATI (Computer Assisted Telephone Interviewing) system. Random selection >is achieved by computerized random-digit dialing. This technique gives every person with a landline phone number (including those with unlisted numbers) an equal chance of being selected.
Landline households are supplemented with a separate, randomly selected sample of cell-phone respondents interviewed in the same time frame. The total combined sample is mathematically weighted to match known demographics of age, race and gender.
The following tables are based on all registered voters in the sample.
Tables
|
And turning to New Jersey, do you approve or disapprove of the job Chris Christie is doing as governor? |
|||||||||||||
|
|
|
PID |
Gender |
Race |
Public Employee Household |
Age |
|||||||
|
|
All |
Dem |
Ind |
Rep |
Male |
Female |
White |
Non-white |
Yes |
No |
18-34 |
35-59 |
60+ |
|
Approve |
44% |
28 |
46 |
67 |
46 |
42 |
47 |
40 |
35 |
48 |
46 |
44 |
42 |
|
Disapprove |
41% |
60 |
40 |
16 |
40 |
43 |
39 |
48 |
56 |
36 |
39 |
43 |
43 |
|
Neither (vol) |
9% |
8 |
9 |
11 |
10 |
9 |
10 |
6 |
7 |
10 |
10 |
8 |
11 |
|
DK/Ref (vol) |
5% |
4 |
5 |
5 |
5 |
5 |
4 |
6 |
2 |
6 |
5 |
5 |
4 |
|
In your opinion, do you think things in New Jersey are moving in the right direction or are they on the wrong track? |
|||||||||||||
|
|
|
PID |
Gender |
Race |
Public Employee Household |
Age |
|||||||
|
|
All |
Dem |
Ind |
Rep |
Male |
Female |
White |
Non-white |
Yes |
No |
18-34 |
35-59 |
60+ |
|
Right direction |
39% |
30 |
33 |
56 |
41 |
37 |
39 |
39 |
30 |
41 |
47 |
40 |
32 |
|
Wrong track |
46% |
58 |
50 |
30 |
42 |
50 |
47 |
45 |
57 |
44 |
37 |
49 |
51 |
|
Neither (vol) |
14% |
12 |
15 |
14 |
16 |
12 |
13 |
15 |
13 |
14 |
16 |
10 |
18 |
|
DK/Ref (vol) |
1% |
0 |
1 |
1 |
1 |
0 |
1 |
1 |
0 |
1 |
0 |
1 |
0 |
|
How closely are you following the recent controversy over the September 2013 lane closures on the George Washington Bridge? |
|||||||||||||
|
|
|
PID |
Gender |
Race |
Public Employee Household |
Age |
|||||||
|
|
All |
Dem |
Ind |
Rep |
Male |
Female |
White |
Non-white |
Yes |
No |
18-34 |
35-59 |
60+ |
|
Very closely |
24% |
25 |
22 |
24 |
24 |
24 |
27 |
17 |
32 |
22 |
13 |
21 |
35 |
|
Somewhat closely |
46% |
48 |
44 |
45 |
46 |
46 |
48 |
42 |
46 |
46 |
44 |
52 |
40 |
|
Not at all closely |
29% |
26 |
32 |
32 |
28 |
31 |
24 |
40 |
23 |
31 |
42 |
26 |
25 |
|
DK/Ref (vol) |
1% |
1 |
3 |
0 |
1 |
0 |
0 |
1 |
0 |
1 |
1 |
1 |
1 |
|
How closely are you following the recent controversy over the September 2013 lane closures on the George Washington Bridge? |
||||
|
|
July |
June |
March |
January |
|
Very closely |
24% |
22 |
34 |
38 |
|
Somewhat closely |
46% |
48 |
48 |
47 |
|
Not at all closely |
29% |
29 |
18 |
15 |
|
DK/Ref (vol) |
1% |
1 |
0 |
0 |