PublicMind Polling, Surveys, Market Analysis
Loading
For immediate release Tuesday, June 23 8 pages
Contact: Krista Jenkins 973.443.8390; kjenkins@fdu.edu
Both Governor Christie and New Jersey legislature receive poor marks from voters, and most believe weak political leadership is to blame for the spate of problems vexing the state. These and other findings emerge from the most recent statewide survey of registered voters conducted by Fairleigh Dickinson University’s PublicMind.
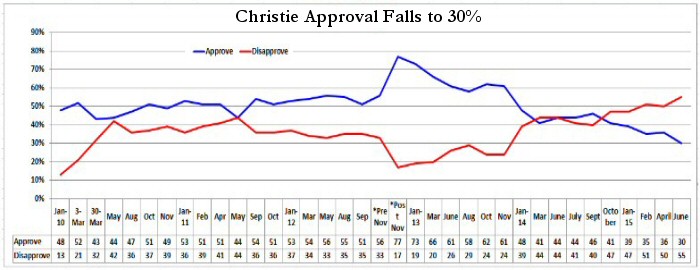
Beginning with Governor Christie, who is still mired in approval ratings that are far beneath where they should be for a presidential aspirant, 30 percent regard him favorably, with significantly more who say they disapprove (55%). His approval is down from where it was in April, the last time voters were asked to weigh in, with 36 percent approving and 50 percent disapproving.
“The good news is that none of his potential presidential opponents have emerged with a decisive lead yet. The bad news is that he is the governor in a state where a sizable majority give a thumbs down to his leadership,” said Krista Jenkins, professor of political science and director of PublicMind.
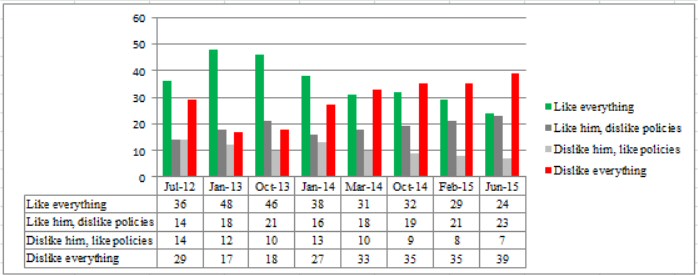
Other questions about the governor reveal more concern. The number of respondents who dislike everything about Christie again exceeds the percent of those who like everything about his leadership. According to the PublicMind survey, 39 percent say they dislike both the Governor and his policies, with 24 percent who say the opposite about him both personally and with regard to his policies. The gap between those who like everything versus those who dislike everything about the Governor is the largest it has been since PublicMind began asking the question. The percentage of those who like everything is down slightly from where it was in February of this year (29%).
When it comes to thinking back over how opinions may have changed concerning the Governor, at least a plurality — including Republicans — say they like Christie less than when he first took office. Just over four-in-ten (42%) say their opinion of the Governor has changed for the worse since taking office. In contrast, more than one-in-ten (13%) say they’ve grown to like him more over the years. Forty-one percent say their opinion has remained unchanged.
“As difficult as these numbers may seem, they need to be understood within the context of the problems the state continues to deal with — many of which he inherited — and his place as a second term governor fighting against the usual problem of incumbent fatigue among the electorate,” said Jenkins. “And, as can be seen in some of the other numbers from this survey, the Governor is not the only one who is disappointing the electorate.”
The state legislature is also evaluated poorly. Barely a quarter (24%) of respondents approve of the job it is collectively doing in addressing the state’s problems, with many more (44%) disapproving. Democrats feel slightly less negative toward the legislature, which is not surprising given the majority of Democrats in both the state and legislature. “But the survey paints a portrait of widespread feelings of disaffection toward state leaders,” said Jenkins.
“Voters appear to feel abandoned by their leaders. Those at the helm in state government are clearly letting those whom they represent down,” said Jenkins. “With sentiments like these, state legislators will more than likely face an unhappy electorate in a few months.”
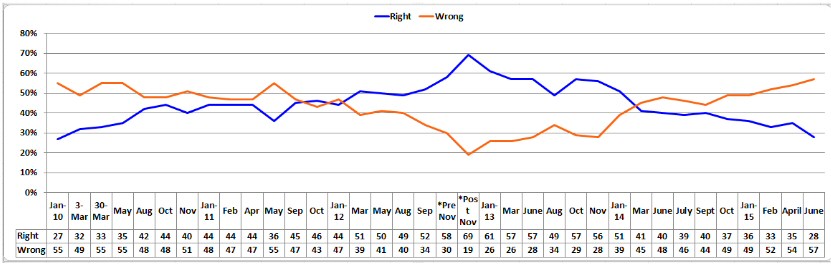
Poor leadership is contributing to worry over the direction the state is headed, as well as what voters believe is the reason behind some of the state’s most significant problems. A clear majority say the state is moving down the wrong path. Concern over the state’s general direction (57%) greatly exceeds the percent of those who are content with the state’s overall well-being (28%).
And, when asked what voters believe is the most pressing problem, opinion is divided among a variety of options, with the public employee pension system (23%) and unemployment (21%) garnering the highest percentages. Almost half of public employee union households (45%) believe fixing the pension system is the most pressing problem compared with fewer than half (17%) of those who reside in non-union households. And the state’s youngest voters are the most concerned about unemployment in the state, with 31 percent of 18 to 34 year-olds identifying the state’s stubborn high unemployment rate as the most worrisome trend.
What is clear, however, is that 50 percent of Garden State voters say political leaders are to blame for stifling solutions to the state’s problems. Significantly fewer believe a divided public (19%) and not enough money (23%) are to blame.
“All of the state’s problems are fixable. At least according to voters, the money and political will are there. Unfortunately, they don’t see political leaders willing to stick their neck out and expend the political capital to fix them,” said Jenkins.
Methodology - The Fairleigh Dickinson University PublicMind survey was conducted by landline and cellular telephone June 15-21, 2015 among a random statewide sample of 792 self-identified registered voters. Results have a margin of sampling error of +/- 3.7 points, including design effect.
Methodology, questions, and tables on the web at: http://publicmind.fdu.edu
Methodology
The most recent survey by Fairleigh Dickinson University’s PublicMind was conducted by telephone from June 15 through 21 using a randomly selected sample of 792 self-identified registered voters in New Jersey. One can be 95 percent confident that the error attributable to sampling has a range of +/- 3.7 percentage points, including design effect. The margin of error for subgroups is larger and varies by the size of that subgroup. Survey results are also subject to non-sampling error. This kind of error, which cannot be measured, arises from a number of factors including, but not limited to, non-response (eligible individuals refusing to be interviewed), question wording, the order in which questions are asked, and variations among interviewers.
PublicMind interviews are conducted by Opinion America of Cedar Knolls, NJ, with professionally trained interviewers using a CATI (Computer Assisted Telephone Interviewing) system. Random selection >is achieved by computerized random-digit dialing. This technique gives every person with a landline phone number (including those with unlisted numbers) an equal chance of being selected.
Landline households are supplemented with a separate, randomly selected sample of cell-phone respondents interviewed in the same time frame. The total combined sample is mathematically weighted to match known demographics of gender, age, education, and race. 440 interviews were conducted on landlines and 352 were conducted on cellular telephones.
The sample was purchased from Marketing Systems Group and the research was funded by Fairleigh Dickinson University.
Tables
|
And turning to New Jersey, do you approve or disapprove of the job Chris Christie is doing as governor? [Randomize approve/disapprove] |
|||||||||||||
|
|
|
PID |
Gender |
Race |
Union household? |
Age |
|||||||
|
|
All |
Dem |
Ind |
Repub |
Male |
Female |
White |
Non-white |
Yes |
No |
18-34 |
35-59 |
60+ |
|
Approve |
30% |
17 |
23 |
50 |
34 |
26 |
33 |
21 |
22 |
32 |
24 |
30 |
32 |
|
Disapprove |
55% |
70 |
55 |
35 |
50 |
60 |
53 |
60 |
67 |
51 |
57 |
56 |
53 |
|
Neither/ Neutral (vol) |
10% |
8 |
14 |
12 |
12 |
9 |
10 |
12 |
8 |
11 |
14 |
9 |
9 |
|
DK/Both (vol) |
4% |
4 |
7 |
3 |
4 |
4 |
3 |
6 |
3 |
5 |
5 |
4 |
4 |
|
Refused (vol) |
1% |
1 |
0 |
1 |
1 |
1 |
1 |
1 |
1 |
1 |
0 |
1 |
1 |
|
In your opinion, do you think things in New Jersey are moving in the right direction or are they on the wrong track? [Rotate right direction/wrong track] |
|||||||||||||
|
|
|
PID |
Gender |
Race |
Union household? |
Age |
|||||||
|
|
All |
Dem |
Ind |
Repub |
Male |
Female |
White |
Non-white |
Yes |
No |
18-34 |
35-59 |
60+ |
|
Right direction |
28% |
23 |
22 |
38 |
31 |
25 |
28 |
28 |
21 |
30 |
29 |
27 |
27 |
|
Wrong track |
57% |
64 |
60 |
45 |
52 |
61 |
56 |
58 |
66 |
54 |
51 |
60 |
57 |
|
DK/Ref (vol) |
15% |
13 |
17 |
17 |
17 |
14 |
17 |
14 |
13 |
15 |
20 |
13 |
16 |
Direction of the state – trend
|
I’m going to read you four statements about Chris Christie. Please tell me which comes closest to your own views: 1) I like him, AND I like his policies; 2) I like him, BUT I don’t like his policies; 3) I don’t like him, BUT I like his policies; 4) I don’t like him, AND I don’t like his policies. RANDOMIZE BUT KEEP 1 AND 2, 3 AND 4 TOGETHER |
|||||||||||||
|
|
|
PID |
Gender |
Race |
Union household? |
Age |
|||||||
|
|
All |
Dem |
Ind |
Repub |
Male |
Female |
White |
Non-white |
Yes |
No |
18-34 |
35-59 |
60+ |
|
Like him and policies |
24% |
10 |
22 |
42 |
26 |
22 |
28 |
15 |
19 |
26 |
18 |
24 |
27 |
|
Like him but not policies |
23% |
21 |
24 |
28 |
26 |
21 |
23 |
26 |
25 |
23 |
26 |
22 |
23 |
|
Don’t like him but like policies |
7% |
7 |
7 |
8 |
9 |
6 |
8 |
7 |
6 |
8 |
10 |
7 |
6 |
|
Don’t like him or his policies |
39% |
56 |
41 |
16 |
34 |
45 |
38 |
43 |
47 |
37 |
39 |
41 |
37 |
|
DK/Refused (vol) |
6% |
5 |
7 |
6 |
6 |
6 |
4 |
9 |
3 |
7 |
6 |
5 |
7 |
|
Since Chris Christie became governor, would you say you’ve grown to like him more, like him less, or has your opinion remained unchanged?[/Rotate like him more and like him less] |
|||||||||||||
|
|
|
PID |
Gender |
Race |
Union household? |
Age |
|||||||
|
|
All |
Dem |
Ind |
Repub |
Male |
Female |
White |
Non-white |
Yes |
No |
18-34 |
35-59 |
60+ |
|
Like him more |
13% |
6 |
12 |
23 |
16 |
10 |
17 |
7 |
10 |
14 |
12 |
13 |
12 |
|
Like him less |
42% |
49 |
35 |
38 |
43 |
41 |
43 |
35 |
54 |
38 |
33 |
46 |
43 |
|
Both (vol) |
1% |
2 |
1 |
1 |
1 |
2 |
2 |
3 |
2 |
1 |
2 |
1 |
1 |
|
Opinion unchanged |
41% |
42 |
48 |
36 |
38 |
44 |
35 |
53 |
34 |
44 |
49 |
38 |
41 |
|
DK/Refused (vol) |
3% |
2 |
4 |
2 |
3 |
3 |
3 |
3 |
1 |
3 |
4 |
2 |
3 |
|
Do you approve or disapprove [rotate] of the job the state legislature is doing? |
|||||||||||||
|
|
|
PID |
Gender |
Race |
Union household? |
Age |
|||||||
|
|
All |
Dem |
Ind |
Repub |
Male |
Female |
White |
Non-white |
Yes |
No |
18-34 |
35-59 |
60+ |
|
Approve |
24% |
26 |
24 |
23 |
27 |
22 |
21 |
31 |
19 |
25 |
30 |
23 |
21 |
|
Disapprove |
44% |
41 |
40 |
51 |
45 |
43 |
46 |
40 |
54 |
41 |
32 |
49 |
46 |
|
Neither/ neutral (vol) |
11% |
13 |
11 |
9 |
9 |
13 |
11 |
11 |
11 |
11 |
12 |
11 |
11 |
|
DK/Both (vol) |
19% |
17 |
25 |
16 |
17 |
22 |
21 |
16 |
12 |
22 |
25 |
16 |
20 |
|
DK/Refused (vol) |
2% |
2 |
1 |
1 |
2 |
1 |
2 |
1 |
3 |
1 |
1 |
2 |
2 |
|
If you had to choose, which of the following do you believe is the biggest issue facing New Jersey? |
|||||||||||||
|
|
|
PID |
Gender |
Race |
Union household? |
Age |
|||||||
|
|
All |
Dem |
Ind |
Repub |
Male |
Female |
White |
Non-white |
Yes |
No |
18-34 |
35-59 |
60+ |
|
Economic growth |
17% |
16 |
12 |
22 |
20 |
15 |
20 |
10 |
16 |
18 |
14 |
19 |
16 |
|
Unemploy-ment |
21% |
21 |
26 |
17 |
17 |
24 |
17 |
28 |
10 |
24 |
31 |
18 |
16 |
|
Road and bridge repairs |
12% |
10 |
19 |
10 |
13 |
10 |
12 |
10 |
5 |
14 |
14 |
9 |
14 |
|
Public employee pension system |
23% |
25 |
16 |
26 |
24 |
23 |
26 |
19 |
45 |
17 |
16 |
26 |
25 |
|
Ethics in state gov’t |
16% |
15 |
17 |
16 |
17 |
15 |
15 |
19 |
14 |
15 |
17 |
16 |
16 |
|
Other (vol) |
6% |
5 |
8 |
6 |
5 |
7 |
6 |
7 |
4 |
7 |
7 |
6 |
7 |
|
DK/Ref (vol) |
4% |
7 |
2 |
2 |
4 |
5 |
3 |
6 |
7 |
5 |
2 |
6 |
6 |
|
Which of the following do you believe is the biggest obstacle to addressing this problem? |
|||||||||||||
|
|
|
PID |
Gender |
Race |
Union household? |
Age |
|||||||
|
|
All |
Dem |
Ind |
Repub |
Male |
Female |
White |
Non-white |
Yes |
No |
18-34 |
35-59 |
60+ |
|
Political leadership |
50 |
49 |
57 |
47 |
55 |
45 |
51 |
48 |
57 |
48 |
48 |
50 |
50 |
|
Money |
23 |
22 |
21 |
26 |
20 |
26 |
25 |
18 |
21 |
24 |
23 |
23 |
24 |
|
A divided public |
19 |
20 |
18 |
20 |
21 |
18 |
18 |
24 |
15 |
21 |
21 |
22 |
15 |
|
Other (vol) |
2 |
3 |
0 |
2 |
2 |
3 |
2 |
3 |
4 |
2 |
3 |
2 |
3 |
|
DK/Ref (vol) |
5 |
6 |
5 |
5 |
2 |
8 |
4 |
6 |
3 |
6 |
4 |
4 |
8 |
Exact Question Wording and Order
NJ1. And turning to New Jersey, do you approve or disapprove of the job Chris Christie is
doing as governor? [Randomize approve/disapprove]
1 Approve
2 Disapprove
3 Neither [vol] or Neutral [vol]
8 DK [vol] or both [vol]
9 Refused (vol)
NJ2. In your opinion, do you think things in New Jersey are moving in the right direction or are they on the wrong track? [Randomize right direction/wrong track]
1 Right direction
2 Wrong track
8 DK (vol)
9 Refused (vol)
NJ3 I’m going to read you four statements about Chris Christie. Please tell me which comes closest to your own views: 1) I like him, AND I like his policies; 2) I like him, BUT I don’t like his policies; 3) I don’t like him, BUT I like his policies; 4) I don’t like him, AND I don’t like his policies.
RANDOMIZE BUT KEEP 1 AND 2, 3 AND 4 TOGETHER
1 I like him, AND I like his policies
2 I like him, BUT I don’t like his policies
3 I don’t like him, BUT I like his policies
4 I don’t like him, AND I don’t like his policies
8 DK (vol)
9 Refused (vol)
NJ4 Since Chris Christie became governor, would you say you’ve grown to like him more, like him less, or has your opinion remained unchanged?[/Rotate like him more and like him less]
1 Like him more
2 Like him less
3 Both [vol]
8 DK (vol)
9 Refused (vol)
NJ5 Do you approve or disapprove of the job the state legislature is doing?
1 Approve
2 Disapprove
3 Neither [vol] or Neutral [vol]
8 DK [vol] or both [vol]
9 Refused (vol)
NJ6 If you had to choose, which of the following do you believe is the biggest issue facing New Jersey?
1 Economic growth
2 Unemployment
3 Road and bridge repairs
4 The public employee pension system
5 Ethics in state government
6 Other (vol)
8 DK (vol)
9 Refused (vol)
NJ7 Which of the following do you believe is the biggest obstacle to addressing this problem?
1 Political leadership
2 Money
3 A divided public
6 Other (vol)
8 DK (vol)
9 Refused (vol)
Weighted sample characteristics
|
|
|
Registered voters N = 785; MoE = +/- 3.5 |
|
Gender |
Male |
49% |
|
|
Female |
51% |
|
Age |
18-34 |
24% |
|
|
35-59 |
41% |
|
|
60+ |
33% |
|
|
Refused |
2% |
|
Race |
White |
66% |
|
|
African American |
11% |
|
|
Hispanic |
15% |
|
|
Asian |
3% |
|
|
Other/Refused |
5% |
|
Union household |
Self |
13% |
|
|
Someone else |
11% |
|
|
No/Refused/DK |
76% |
|
Party (with leaners) |
Dem |
44% |
|
|
Ind/DK/Refused |
23% |
|
|
Repub |
34% |