PublicMind Polling, Surveys, Market Analysis
Loading
For immediate release Monday, June 29 7 pages
Contact: Krista Jenkins 973.443.8390; kjenkins@fdu.edu
In the eyes of New Jersey voters, the top Republican and Democratic candidates for President of the United States are also the candidates who are the most disliked according to Fairleigh Dickinson University’s PublicMind.
New Jersey Governor Christie may be laboring under declining approval in the state, but when it comes to his presidential prospects, New Jersey Republicans put him at the top along with former Florida governor, Jeb Bush. Bush and Christie are tied for support among Republicans in the state at 18 percent each. Behind them is real estate developer and reality television star, Donald Trump at 11 percent. Behind them are contenders – those who have both announced their candidacy and those still considering their options – who garner support in the single digits.
Some Garden State Republicans identify Christie and Trump as candidates they would NEVER support, regardless of who the Democratic opponent turns out to be. Trump commands the condemnation of 27 percent of registered Republicans, with the Governor not too far behind (22%). Half of registered Republicans (52%) said they could identify someone whom they would never support in the general election.
“In a crowded field like the Republican crop of possible nominees, the fact that Governor Christie evokes passions on both sides at least sets him apart from others who generate a collective yawn,” said Krista Jenkins, professor of political science and director of PublicMind.
On the Democratic side, Hillary Clinton retains her lead over other prospective nominees. Almost two-thirds (63%) of registered Democrats favor her over Vermont senator Bernie Sanders (15%) and Martin O’Malley (3%). At the same time, 29 percent of Democrats categorically reject the candidacy of Hillary Clinton. However, it is important to note that as compared with Republicans, a far smaller percentage of Democrats said they could identify someone whom they would never support in the general election. One-in-five (19%) registered Democrats compared with half (52%) of registered Republicans feel strongly about saying no to one of their own.
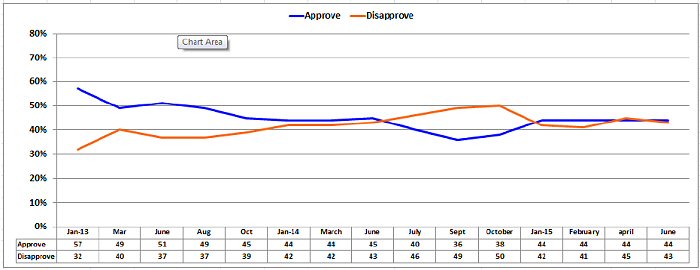
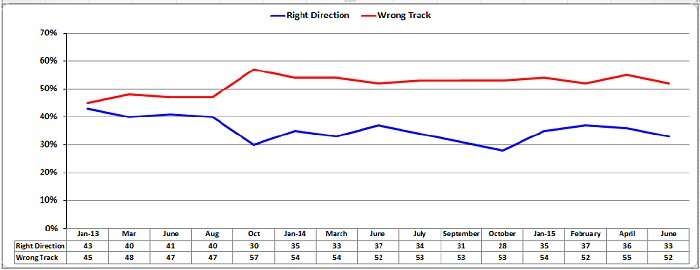
Turning to the Obama presidency, the “same story, different day” narrative prevails. Garden State voters are divided over his leadership with 44 percent who say they approve of his job performance and 43 percent who are opposed. And, when it comes to the general health of the nation, a third (33%) say the country is on stable footing with 52 percent who believe it is headed down the wrong track. These numbers are virtually unchanged from the past few surveys PublicMind has conducted of registered voters in the Garden State.
Methodology - The Fairleigh Dickinson University PublicMind survey was conducted by landline and cellular telephone June 15-21, 2015 among a random statewide sample of 792 self-identified registered voters. Results have a margin of sampling error of +/- 3.7 points, including the design effect.
Methodology, questions, and tables on the web at: http://publicmind.fdu.edu
Methodology
The most recent survey by Fairleigh Dickinson University’s PublicMind was conducted by telephone from June 15 through 21 using a randomly selected sample of 792 self-identified registered voters in New Jersey. One can be 95 percent confident that the error attributable to sampling has a range of +/- 3.7 percentage points, including the design effect. The margin of error for subgroups is larger and varies by the size of that subgroup. Survey results are also subject to non-sampling error. This kind of error, which cannot be measured, arises from a number of factors including, but not limited to, non-response (eligible individuals refusing to be interviewed), question wording, the order in which questions are asked, and variations among interviewers.
PublicMind interviews are conducted by Opinion America of Cedar Knolls, NJ, with professionally trained interviewers using a CATI (Computer Assisted Telephone Interviewing) system. Random selection >is achieved by computerized random-digit dialing. This technique gives every person with a landline phone number (including those with unlisted numbers) an equal chance of being selected.
Landline households are supplemented with a separate, randomly selected sample of cell-phone respondents interviewed in the same time frame. The total combined sample is mathematically weighted to match known demographics of gender, age, education, and race. 440 interviews were conducted on landlines and 352 were conducted on cellular telephones.
The sample was purchased from Marketing Systems Group and the research was funded by Fairleigh Dickinson University.
Tables
I’m going to read you a list of current and prospective candidates for the Republican nomination for president. If the election were held today, who would you vote for? (READ LIST) [N = 267; MoE = 6.3] |
|
|
Jeb Bush |
18% |
|
Ben Carson |
6% |
|
Chris Christie |
18% |
|
Ted Cruz |
3% |
|
Carly Fiorina |
3% |
|
Lindsey Graham |
1% |
|
Mike Huckabee |
3% |
|
Bobby Jindal |
0 |
|
John Kasich |
0 |
|
George Pataki |
2% |
|
Rand Paul |
5% |
|
Rick Perry |
2% |
|
Marco Rubio |
6% |
|
Rick Santorum |
2% |
|
Donald Trump |
11% |
|
Scott Walker |
9% |
|
Other (vol) |
2% |
|
Wouldn’t vote (vol) |
2% |
|
DK/Refused (vol) |
10% |
PRESRB Is there anyone I just mentioned who you would NEVER support for president, regardless who they ran against? If yes, ask who [N=139] |
|
|
Jeb Bush |
16% |
|
Ben Carson |
1% |
|
Chris Christie |
22% |
|
Ted Cruz |
4% |
|
Carly Fiorina |
0 |
|
Lindsey Graham |
3% |
|
Mike Huckabee |
2% |
|
Bobby Jindal |
1% |
|
John Kasich |
0 |
|
George Pataki |
0 |
|
Rand Paul |
9% |
|
Rick Perry |
2% |
|
Marco Rubio |
2% |
|
Rick Santorum |
4% |
|
Donald Trump |
27% |
|
Scott Walker |
1% |
|
Other (vol) |
2% |
|
Wouldn’t vote (vol) |
1% |
|
DK/Refused (vol) |
1% |
I’m going to read you a list of candidates for the Democratic nomination for president. If the election were held today, who would you vote for? (READ LIST) [N = 345; MoE 5.5] |
|
|
Lincoln Chafee |
0 |
|
Hillary Clinton |
63% |
|
Martin O’Maley |
3% |
|
Bernie Sanders |
15% |
|
Other (vol) |
1% |
|
Wouldn’t vote (vol) |
3% |
|
DK/Refused (vol) |
14% |
|
PRESDB Is there anyone I just mentioned who you would NEVER support for president, regardless who they ran against? If yes, ask who [precoded] [N = 64] |
|
|
Lincoln Chafee |
14% |
|
Hillary Clinton |
29% |
|
Martin O’Maley |
24% |
|
Bernie Sanders |
11% |
|
Wouldn’t vote (vol) |
2% |
|
Other (vol) |
13% |
|
DK/Refused (vol) |
7% |
|
First, do you approve or disapprove of the way Barack Obama is handling his job as President? [Randomize approve/disapprove] |
|||||||||||||
|
|
|
PID |
Gender |
Race |
Education |
Age |
|||||||
|
|
All |
Dem |
Ind |
Repub |
Male |
Female |
White |
Non-white |
No college grad |
College grad + |
18-34 |
35-59 |
60+ |
|
Approve |
44 |
75 |
34 |
12 |
41 |
47 |
32 |
70 |
42 |
47 |
49 |
44 |
40 |
|
Disapprove |
43 |
13 |
42 |
78 |
44 |
39 |
54 |
15 |
39 |
43 |
32 |
43 |
46 |
|
DK/Both (vol) |
14 |
12 |
23 |
9 |
15 |
14 |
14 |
14 |
19 |
9 |
19 |
12 |
14 |
|
Refused (vol) |
1 |
0 |
1 |
1 |
0 |
1 |
1 |
1 |
0 |
1 |
0 |
1 |
1 |
Obama’s second term – job approval, trend
|
In your opinion, do you believe the country is moving in the right direction or is it on the wrong track?[Rotate right direction/wrong track] |
|||||||||||||
|
|
|
PID |
Gender |
Race |
Education |
Age |
|||||||
|
|
All |
Dem |
Ind |
Repub |
Male |
Female |
White |
Non-white |
No college grad |
College grad + |
18-34 |
35-59 |
60+ |
|
Right direction |
33 |
53 |
28 |
11 |
35 |
32 |
24 |
52 |
32 |
35 |
38 |
32 |
31 |
|
Wrong track |
52 |
26 |
58 |
82 |
51 |
53 |
63 |
29 |
53 |
51 |
48 |
53 |
55 |
|
DK/Both (vol) |
14 |
20 |
13 |
6 |
13 |
15 |
12 |
17 |
14 |
14 |
14 |
14 |
13 |
|
Refused (vol) |
1 |
1 |
1 |
1 |
1 |
1 |
0 |
1 |
0 |
1 |
0 |
0 |
1 |
Obama’s second term – Right direction/wrong track, trend
Exact Question Wording and Order
US1. First, do you approve or disapprove of the way Barack Obama is handling his job as President?
1 Approve
2 Disapprove
8 DK (vol)
9 Refused (vol)
US2. In your opinion, do you believe the country is moving in the right direction or is it on the wrong track?
1 Right direction
2 Wrong track
8 DK (vol)
9 Refused (vol)
NJ1 through NJ7 released June 23
MJ1 through MJ2 withheld for subsequent release
AC1 through AC6 released June 24
VAC1 through VAC4 withheld for subsequent release
Finally, just some questions about yourself…
D1 Regardless of who you might vote for, do you consider yourself a….ROTATE… Democrat, a Republican, or an Independent?
1 Democrat
2 Republican
3 Independent [If Independent, ask D1b]
4 Other [DON’T READ]
8 Don’t Know [DON’T READ]
9 Ref [DON’T READ]
D1b Which way do you lean?
1 Democrat
2 Republican
3 Neither
8 DK (Vol)
PRESRA I’m going to read you a list of current and prospective candidates for the Republican nomination for president. If the election were held today, who would you vote for? (READ LIST)
1 Jeb Bush
2 Ben Carson
3 Chris Christie
4 Ted Cruz
5 Carly Fiorina
6 Lindsey Graham
7 Mike Huckabee
8 Bobby Jindal
9 John Kasich
10 George Pataki
11 Rand Paul
12 Rick Perry
13 Marco Rubio
14 Rick Santorum
15 Donald Trump
16 Scott Walker
17 Other (vol)
18 Wouldn’t vote (vol)
98 DK (vol)
99 Refused (vol)
PRESRB Is there anyone I just mentioned who you would NEVER support for president, regardless
who they ran against? If yes, ask who [precoded]
PRESDA I’m going to read you a list of candidates for the Democratic nomination for president. If
the election were held today, who would you vote for? (READ LIST)
1 Hillary Clinton
2 Bernie Sanders
3 Lincoln Chafee
4 Martin O’Maley
5 Other (vol)
8 Wouldn’t vote (vol)
98 DK (vol)
99 Refused (vol)
PRESDB Is there anyone I just mentioned who you would NEVER support for president, regardless who they ran against? If yes, ask who [precoded]
Weighted sample characteristics
|
|
|
Registered voters N = 792; MoE = +/- 3.7 |
|
Gender |
Male |
49% |
|
|
Female |
51% |
|
Age |
18-34 |
24% |
|
|
35-59 |
41% |
|
|
60+ |
33% |
|
|
Refused |
2% |
|
Race |
White |
66% |
|
|
African American |
11% |
|
|
Hispanic |
15% |
|
|
Asian |
3% |
|
|
Other/Refused |
5% |
|
Union household |
Self |
13% |
|
|
Someone else |
11% |
|
|
No/Refused/DK |
76% |
|
Party (with leaners) |
Dem |
44% |
|
|
Ind/DK/Refused |
23% |
|
|
Repub |
34% |