PublicMind Polling, Surveys, Market Analysis
Loading
For immediate release Thursday, January 15, 2015 7 pp.
Contact: Krista Jenkins 973.443.8390; kjenkins@fdu.edu
After five years in office, only one-in-five New Jersey residents believe the Christie years have been good for the average citizen, over half (52%) believe taxes and spending have grown more burdensome, and three-quarters (75%) believe Governor Christie can point to only minor or no real accomplishments since taking office. Additionally, most rate the governor as average compared to his predecessors. These are just a few of the findings from Fairleigh Dickinson University’s PublicMind that examines perceptions of conditions in the state since Chris Christie became governor.
Residents were polled on New Jersey’s economy, transportation system, government ethics and honesty, environmental conditions, the condition of the state’s major cities, taxes and spending, the state’s reputation to outsiders, and the quality of life for people who live in New Jersey and asked whether conditions have improved, worsened, or remained the same under his watch.
Evaluations of How Conditions in New Jersey have Fared Under Governor Christie
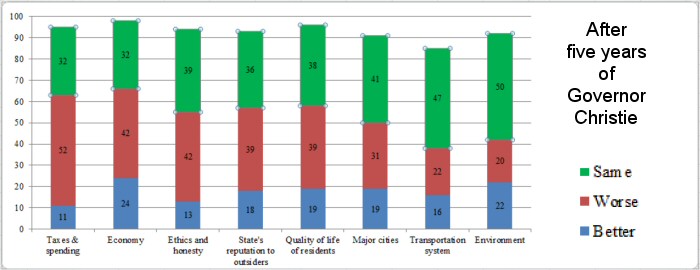
Beginning with economic issues – taxes and spending and the overall health of New Jersey’s economy - residents are decidedly critical of how conditions have fared. Forty-two percent say the economy has grown worse, and over half (52%) say the same about taxes and spending. Democrats are more decisive, although Republicans are not overwhelmingly convinced economic conditions have stayed at least the same or improved under Governor Christie’s watch.
“Voters look to what someone has done in the past for insight into what the future may hold. Many in the state don’t believe the economic conditions have improved while Governor Christie has been in office, and that may complicate his appeal outside New Jersey,” said Krista Jenkins, professor of political science and director of PublicMind.
For the remaining six issues, opinion is either clearly on the side of “status quo” or divided among those who see things about the same or worsening. The numbers suggest that the governor has had little effect on three areas: The state’s transportation system, environmental conditions in the state, and the condition of the state’s major cities. Across these areas, a plurality of respondents say little has changed (47 percent for the state’s transportation system, 50 percent for environmental conditions, and 41 percent for the state’s major cities, respectively).
“Given that Governor Christie was criticized for withdrawing New Jersey’s support from the ARC tunnel to Manhattan and the Regional Greenhouse Gas Initiative, it could be good news for the governor that residents don’t feel that he has a lot of impact on transportation and environmental conditions in the state,” said Jenkins.
As for state government ethics and honesty, the state’s reputation to outsiders, and the quality of life for people who live in New Jersey, opinion is equally divided among those who didn’t see any change and those who believe things have grown worse. Around four-in-ten say ethics and honesty in the state have worsened (42%) or remained the same (39%); similar numbers describe those who believe the state’s reputation to outsiders has worsened (39%) or remained the same (36%); and around 40 percent say the lives of people in the state are the same or worse since Governor Christie was sworn into office. Interestingly, women and men differ on this question by a sizable margin. Almost half of all women (45%) say the lives of people in New Jersey have grown worse, compared with just 32 percent of men. A quarter of men (25%) believe conditions have improved for average citizens, with one-in-eight women (13%) who say the same. Across all of these domains, Republicans are less likely to be critical of the governor; however, even the governor’s natural allies seem unimpressed with the pace of positive change in the state over the past five years.
“As Governor Christie has worked to establish himself as a leader on fiscal restraint, tax reform, and economic growth, as well as creating a political environment that’s open and honest, these numbers might sting,” said Jenkins. “Of course, governing is a shared enterprise with the legislature, so it’s hard to lay the blame for these numbers squarely at the feet of the chief executive. But, the governor’s potential candidacy would be an easier sell to unfamiliar outsiders if his constituents believe that their lives are easier now than before he was sworn in, and that corruption in the state has been replaced by transparency and honesty.”
Around half of residents (47%) believe the governor has had some modest success as governor. An additional 28 percent believe he’s had no real accomplishments since becoming governor. Comparatively fewer (17%) believe he can claim “major” accomplishments while in office.
“Although the governor may disagree with public sentiment on this measure, clearly his administration has been ineffective in marketing his accomplishments to the public,” said Jenkins.
Finally, when voters compare Governor Christie to his predecessors, the vast majority (64%) puts him in the center of the pack, rating him as decidedly average. One-in-eight (13%) say Christie is among New Jersey’s best governors and 21 percent who think he’s one of the worst.
Opinion on this question is relatively constant across a variety of demographic categories, including among partisans of different stripes. A majority of both Republicans and Democrats say the governor is about average, with Republicans and Democrats offering mirror images of the other on whether the governor has been New Jersey’s best or worst.
“The takeaway from all of these numbers is pretty straightforward: Most New Jerseyans believe time is about the only thing that’s really advanced over the past few years,” said Jenkins.
The Fairleigh Dickinson University poll of 803 New Jersey residents was conducted by telephone with both landline and cell phones from January 5 through January 11. The margin of error is +/- 3.7 percentage points.
Methodology, questions, and tables on the web at: http://publicmind.fdu.edu
Radio actualities at 201.692.2846 For more information, please call 201.692.7032
Methodology
The most recent survey by Fairleigh Dickinson University’s PublicMind was conducted by telephone from January 5 through January 11 using a randomly selected sample of 803 adults aged 18 and older in New Jersey. One can be 95 percent confident that the error attributable to sampling has a range of +/- 3.7 percentage points. The margin of error for subgroups is larger and varies by the size of that subgroup. Survey results are also subject to non-sampling error. This kind of error, which cannot be measured, arises from a number of factors including, but not limited to, non-response (eligible individuals refusing to be interviewed), question wording, the order in which questions are asked, and variations among interviewers.
PublicMind interviews are conducted by Opinion America of Cedar Knolls, NJ, with professionally trained interviewers using a CATI (Computer Assisted Telephone Interviewing) system. Random selection is achieved by computerized random-digit dialing. This technique gives every person with a landline phone number (including those with unlisted numbers) an equal chance of being selected.
Landline households are supplemented with a separate, randomly selected sample of cell-phone respondents interviewed in the same time frame. The total combined sample is mathematically weighted to match known demographics of age, race and gender.
The sample was purchased from Marketing Systems Group and the research was funded by Fairleigh Dickinson University.
Tables
I’m going to read you some issue areas. For each please just tell me if it has become better or worse since Chris Christie became governor. First… [randomize}…
|
The economy in New Jersey |
|||||||||||||
|
|
|
PID |
Gender |
Race |
Union household? |
Age |
|||||||
|
|
All |
Dem |
Ind |
Repub |
Male |
Female |
White |
Non-white |
Yes |
No |
18-34 |
35-59 |
60+ |
|
Better |
24% |
18 |
26 |
33 |
29 |
19 |
23 |
23 |
19 |
25 |
27 |
22 |
22 |
|
Worse |
42% |
48 |
37 |
31 |
36 |
47 |
42 |
40 |
47 |
40 |
40 |
43 |
40 |
|
Same |
32% |
31 |
35 |
32 |
33 |
30 |
31 |
33 |
31 |
31 |
29 |
32 |
34 |
|
DK/Ref (vol) |
3% |
2 |
2 |
4 |
2 |
4 |
3 |
3 |
2 |
3 |
3 |
2 |
4 |
|
The state’s transportation system |
|||||||||||||
|
|
|
PID |
Gender |
Race |
Union household? |
Age |
|||||||
|
|
All |
Dem |
Ind |
Repub |
Male |
Female |
White |
Non-white |
Yes |
No |
18-34 |
35-59 |
60+ |
|
Better |
16% |
17 |
15 |
15 |
19 |
14 |
14 |
21 |
13 |
17 |
20 |
16 |
13 |
|
Worse |
22% |
25 |
26 |
13 |
19 |
24 |
23 |
17 |
28 |
20 |
18 |
22 |
24 |
|
Same |
47% |
46 |
46 |
50 |
50 |
44 |
44 |
53 |
44 |
47 |
53 |
48 |
41 |
|
DK/Ref (vol) |
15% |
12 |
13 |
21 |
12 |
18 |
19 |
9 |
15 |
16 |
9 |
14 |
22 |
|
State government ethics and honesty |
|||||||||||||
|
|
|
PID |
Gender |
Race |
Union household? |
Age |
|||||||
|
|
All |
Dem |
Ind |
Repub |
Male |
Female |
White |
Non-white |
Yes |
No |
18-34 |
35-59 |
60+ |
|
Better |
13% |
7 |
12 |
21 |
15 |
10 |
14 |
10 |
9 |
14 |
10 |
8 |
21 |
|
Worse |
42% |
51 |
49 |
23 |
39 |
45 |
44 |
40 |
51 |
40 |
41 |
44 |
40 |
|
Same |
39% |
37 |
32 |
49 |
41 |
38 |
37 |
43 |
36 |
40 |
41 |
43 |
33 |
|
DK/Ref (vol) |
6% |
4 |
8 |
6 |
6 |
6 |
6 |
6 |
4 |
7 |
8 |
4 |
6 |
|
Environmental conditions in the state |
|||||||||||||
|
|
|
PID |
Gender |
Race |
Union household? |
Age |
|||||||
|
|
All |
Dem |
Ind |
Repub |
Male |
Female |
White |
Non-white |
Yes |
No |
18-34 |
35-59 |
60+ |
|
Better |
22% |
18 |
22 |
28 |
25 |
19 |
21 |
24 |
21 |
23 |
21 |
22 |
22 |
|
Worse |
20% |
29 |
20 |
7 |
19 |
21 |
22 |
17 |
21 |
20 |
17 |
20 |
23 |
|
Same |
50% |
47 |
51 |
52 |
50 |
49 |
48 |
54 |
50 |
48 |
54 |
50 |
46 |
|
DK/Ref (vol) |
8% |
5 |
7 |
11 |
6 |
9 |
9 |
6 |
8 |
1 |
8 |
7 |
9 |
|
The state’s major cities |
|||||||||||||
|
|
|
PID |
Gender |
Race |
Union household? |
Age |
|||||||
|
|
All |
Dem |
Ind |
Repub |
Male |
Female |
White |
Non-white |
Yes |
No |
18-34 |
35-59 |
60+ |
|
Better |
19% |
17 |
22 |
22 |
23 |
16 |
17 |
23 |
16 |
20 |
28 |
19 |
11 |
|
Worse |
31% |
33 |
27 |
25 |
31 |
30 |
32 |
29 |
38 |
29 |
23 |
33 |
34 |
|
Same |
41% |
45 |
38 |
42 |
40 |
43 |
41 |
42 |
40 |
41 |
41 |
41 |
43 |
|
DK/Ref (vol) |
9% |
5 |
13 |
11 |
7 |
11 |
11 |
5 |
5 |
10 |
8 |
7 |
11 |
|
Taxes and spending in the state |
|||||||||||||
|
|
|
PID |
Gender |
Race |
Union household? |
Age |
|||||||
|
|
All |
Dem |
Ind |
Repub |
Male |
Female |
White |
Non-white |
Yes |
No |
18-34 |
35-59 |
60+ |
|
Better |
11% |
6 |
10 |
21 |
12 |
9 |
11 |
10 |
9 |
12 |
9 |
10 |
13 |
|
Worse |
52% |
58 |
54 |
40 |
50 |
55 |
50 |
55 |
58 |
51 |
47 |
55 |
52 |
|
Same |
32% |
32 |
31 |
34 |
33 |
30 |
33 |
31 |
30 |
32 |
35 |
31 |
30 |
|
DK/Ref (vol) |
5% |
5 |
4 |
5 |
5 |
6 |
6 |
4 |
3 |
6 |
8 |
4 |
4 |
|
The state’s reputation to outsiders |
|||||||||||||
|
|
|
PID |
Gender |
Race |
Union household? |
Age |
|||||||
|
|
All |
Dem |
Ind |
Repub |
Male |
Female |
White |
Non-white |
Yes |
No |
18-34 |
35-59 |
60+ |
|
Better |
18% |
13 |
17 |
27 |
20 |
16 |
18 |
16 |
15 |
19 |
19 |
15 |
21 |
|
Worse |
39% |
46 |
38 |
30 |
35 |
44 |
41 |
37 |
47 |
38 |
40 |
41 |
37 |
|
Same |
36% |
35 |
40 |
36 |
38 |
34 |
34 |
43 |
33 |
36 |
37 |
39 |
32 |
|
DK/Ref (vol) |
7% |
6 |
4 |
7 |
7 |
6 |
7 |
5 |
5 |
7 |
4 |
5 |
10 |
|
The lives of people who live in New Jersey |
|||||||||||||
|
|
|
PID |
Gender |
Race |
Union household? |
Age |
|||||||
|
|
All |
Dem |
Ind |
Repub |
Male |
Female |
White |
Non-white |
Yes |
No |
18-34 |
35-59 |
60+ |
|
Better |
19% |
13 |
20 |
27 |
25 |
13 |
17 |
20 |
11 |
21 |
23 |
16 |
19 |
|
Worse |
39% |
45 |
40 |
26 |
32 |
45 |
38 |
39 |
49 |
36 |
31 |
42 |
40 |
|
Same |
38% |
39 |
36 |
42 |
40 |
37 |
39 |
39 |
35 |
39 |
43 |
39 |
35 |
|
DK/Ref (vol) |
5% |
3 |
5 |
5 |
3 |
5 |
6 |
2 |
5 |
5 |
4 |
3 |
6 |
|
Since Governor Christie took office in 2009, would you say he’s had major accomplishments, minor accomplishments, or no real accomplishments as governor? |
|||||||||||||
|
|
|
PID |
Gender |
Race |
Union household? |
Age |
|||||||
|
|
All |
Dem |
Ind |
Repub |
Male |
Female |
White |
Non-white |
Yes |
No |
18-34 |
35-59 |
60+ |
|
Major |
17% |
10 |
17 |
30 |
18 |
16 |
18 |
14 |
11 |
19 |
15 |
16 |
20 |
|
Minor |
47% |
46 |
49 |
49 |
49 |
45 |
48 |
47 |
51 |
46 |
44 |
49 |
44 |
|
None |
28% |
38 |
22 |
13 |
26 |
29 |
26 |
31 |
30 |
27 |
29 |
29 |
26 |
|
Both (vol) |
3% |
2 |
4 |
5 |
3 |
3 |
3 |
4 |
4 |
3 |
4 |
2 |
4 |
|
DK/Ref (vol) |
6% |
4 |
6 |
3 |
3 |
7 |
6 |
4 |
3 |
5 |
9 |
4 |
5 |
|
Overall, how would you rate Governor Christie? Has he been one of New Jersey’s best governors, one of its worst, or is he somewhere in the middle? |
|||||||||||||
|
|
|
PID |
Gender |
Race |
Union household? |
Age |
|||||||
|
|
All |
Dem |
Ind |
Repub |
Male |
Female |
White |
Non-white |
Yes |
No |
18-34 |
35-59 |
60+ |
|
Best |
13% |
7 |
13 |
24 |
16 |
10 |
16 |
8 |
10 |
14 |
10 |
12 |
18 |
|
Worst |
21% |
31 |
17 |
7 |
18 |
25 |
21 |
21 |
33 |
18 |
22 |
22 |
20 |
|
Middle |
64% |
61 |
69 |
67 |
64 |
64 |
61 |
68 |
56 |
66 |
65 |
66 |
60 |
|
DK/Ref (vol) |
2% |
1 |
2 |
2 |
2 |
1 |
1 |
3 |
1 |
2 |
4 |
1 |
2 |
Exact Question Wording and Order
US1 and US2 withheld for future release
NJ1 through NJ2 released January 13
NJ3 Since Governor Christie took office in 2009, would you say he’s had major accomplishments,
minor accomplishments, or no real accomplishments as governor?
1 Major
2 Minor
3 No real accomplishments
4 Both major and minor (vol)
8 DK (vol)
9 Refused (vol)
NJ4 I’m going to read you some issue areas. For each please just tell me if it has become better or worse or hasn’t changed since Chris Christie became governor. First… [randomize order]…
NJ4A The economy in New Jersey
NJ4B The state’s transportation system
NJ4C State government ethics and honesty
NJ4D Environmental conditions in the state
NJ4E The state’s major cities
NJ4F Taxes and spending in the state
NJ4G The state’s reputation to outsiders
NJ4H The lives of people who live in New Jersey
1 Better
2 Worse
3 Same
8 DK (vol)
9 Refused (vol)
NJ5 Overall, how would you rate Governor Christie? Has he been one of New Jersey’s best
governors, one of its worst, or is he somewhere in the middle?
1 Best
2 Worst
3 Middle
8 DK (vol)
9 Refused (vol)
Weighted sample characteristics
|
|
|
N = 803; MoE = +/- 3.5 |
|
Gender |
Male |
49% |
|
|
Female |
51% |
|
Age |
18-34 |
25% |
|
|
35-59 |
44% |
|
|
60+ |
29% |
|
|
Refused |
3% |
|
Race |
White |
61% |
|
|
African American |
13% |
|
|
Hispanic |
15% |
|
|
Asian |
6% |
|
|
Other/Refused |
4% |
|
Union household |
Self |
13% |
|
|
Someone else |
8% |
|
|
No |
79% |
|
Party (with leaners) |
Dem |
45% |
|
|
Ind/DK/Refused |
28% |
|
|
Repub |
27% |